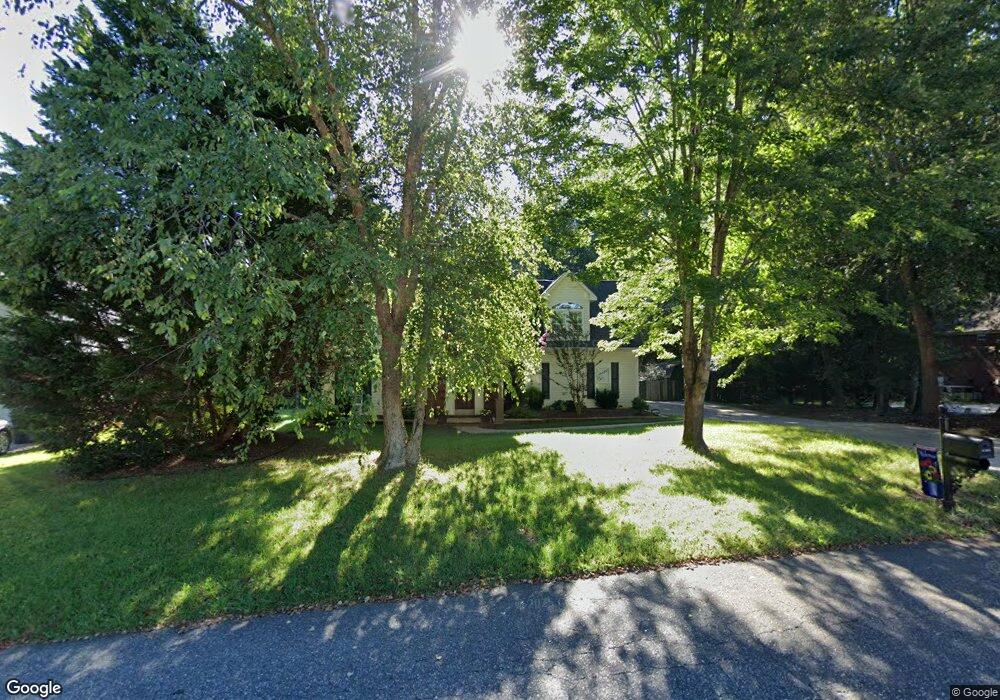
1720 Eden Glen Dr Dallas, NC 28034
Estimated Value: $359,597 - $430,000
3
Beds
3
Baths
1,912
Sq Ft
$204/Sq Ft
Est. Value
About This Home
This home is located at 1720 Eden Glen Dr, Dallas, NC 28034 and is currently estimated at $389,149, approximately $203 per square foot. 1720 Eden Glen Dr is a home located in Gaston County with nearby schools including Costner Elementary School, W.C. Friday Middle School, and North Gaston High School.
Ownership History
Date
Name
Owned For
Owner Type
Purchase Details
Closed on
Nov 21, 2005
Sold by
Thompson Jeffrey T and Thompson Donna Howe
Bought by
Thompson Donna Howe
Current Estimated Value
Purchase Details
Closed on
Mar 18, 2004
Sold by
Roberson Homes Inc
Bought by
Thompson Jeffrey T and Howe Donna C
Home Financials for this Owner
Home Financials are based on the most recent Mortgage that was taken out on this home.
Original Mortgage
$170,926
Outstanding Balance
$80,163
Interest Rate
5.72%
Mortgage Type
FHA
Estimated Equity
$308,986
Purchase Details
Closed on
Jan 6, 2003
Sold by
Cdc Development
Bought by
Roberson Homes Inc
Home Financials for this Owner
Home Financials are based on the most recent Mortgage that was taken out on this home.
Original Mortgage
$141,600
Interest Rate
6.1%
Create a Home Valuation Report for This Property
The Home Valuation Report is an in-depth analysis detailing your home's value as well as a comparison with similar homes in the area
Home Values in the Area
Average Home Value in this Area
Purchase History
| Date | Buyer | Sale Price | Title Company |
|---|---|---|---|
| Thompson Donna Howe | -- | -- | |
| Thompson Jeffrey T | $180,000 | -- | |
| Roberson Homes Inc | $25,500 | -- |
Source: Public Records
Mortgage History
| Date | Status | Borrower | Loan Amount |
|---|---|---|---|
| Open | Thompson Jeffrey T | $170,926 | |
| Previous Owner | Roberson Homes Inc | $141,600 | |
| Closed | Roberson Homes Inc | $15,500 |
Source: Public Records
Tax History Compared to Growth
Tax History
| Year | Tax Paid | Tax Assessment Tax Assessment Total Assessment is a certain percentage of the fair market value that is determined by local assessors to be the total taxable value of land and additions on the property. | Land | Improvement |
|---|---|---|---|---|
| 2025 | $3,034 | $292,030 | $28,000 | $264,030 |
| 2024 | $2,976 | $292,030 | $28,000 | $264,030 |
| 2023 | $3,008 | $292,030 | $28,000 | $264,030 |
| 2022 | $2,443 | $198,600 | $22,500 | $176,100 |
| 2021 | $2,483 | $198,600 | $22,500 | $176,100 |
| 2019 | $2,463 | $198,600 | $22,500 | $176,100 |
| 2018 | $2,105 | $165,709 | $22,400 | $143,309 |
| 2017 | $2,153 | $169,561 | $22,400 | $147,161 |
| 2016 | $2,153 | $169,561 | $0 | $0 |
| 2014 | $2,447 | $195,737 | $30,000 | $165,737 |
Source: Public Records
Map
Nearby Homes
- 4016 Hereford Ln
- 2017 Longhorn Dr
- 912 Carole Summey Dr
- 4040 Hereford Ln
- 00 Summey Farm Dr
- 109 Churchill Rd
- 1001 College Blvd
- 600 Summey Farm Dr
- 5606 Katherine Ct
- 6103 Dane Dr
- 111 Summey Barker Dr
- 5117 Park Place Dr
- 806 Dogwood Dr
- 0 Dallas High Shoals Hwy
- 606 Brookgreen Dr
- 322 Pinkney Rd
- 403 W Lewis St
- 504 W Church St
- 1819 Ratchford Dr
- 3259 Winesap Dr
- 1718 Eden Glen Dr
- 1724 Eden Glen Dr
- 1728 Eden Glen Dr
- 1716 Eden Glen Dr
- 1721 Eden Glen Dr
- 1725 Eden Glen Dr
- 1719 Eden Glen Dr
- 1712 Eden Glen Dr
- 1715 Eden Glen Dr
- 1205 Springhill Ct
- 1711 Eden Glen Dr
- 1706 Eden Glen Dr
- 1707 Eden Glen Dr
- 3044 Hereford Ln
- 3048 Hereford Ln
- 1703 Eden Glen Dr
- 3040 Hereford Ln
- 3052 Hereford Ln
- 1206 Springhill Ct
- 3036 Hereford Ln