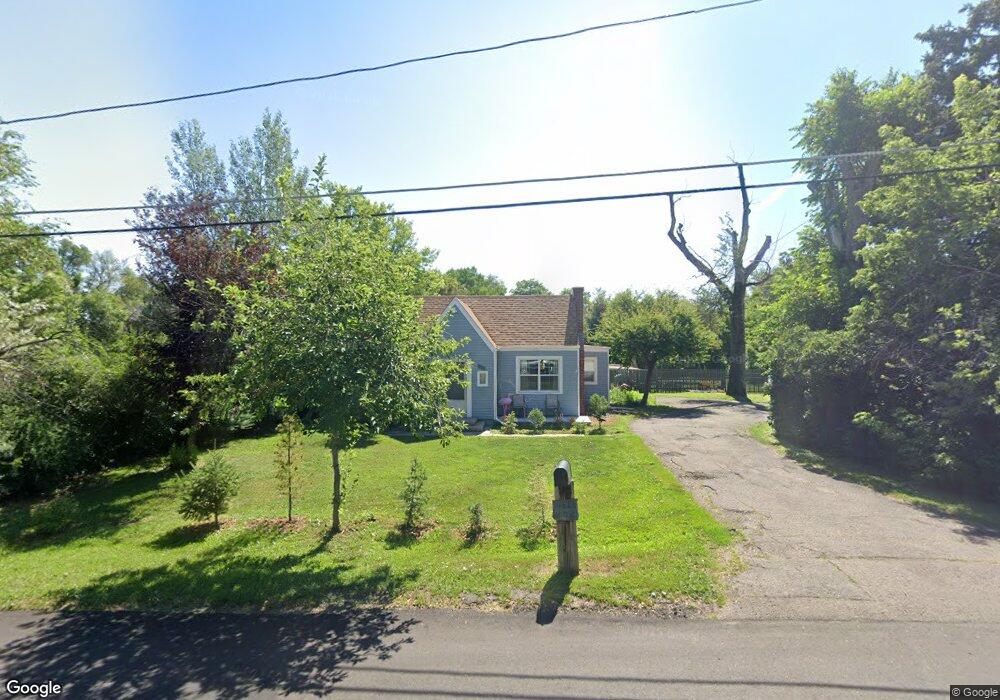
1720 Hoyt St Lakewood, CO 80215
Morse Park NeighborhoodEstimated Value: $504,000 - $650,000
2
Beds
3
Baths
1,372
Sq Ft
$420/Sq Ft
Est. Value
About This Home
This home is located at 1720 Hoyt St, Lakewood, CO 80215 and is currently estimated at $576,490, approximately $420 per square foot. 1720 Hoyt St is a home located in Jefferson County with nearby schools including Slater Elementary School, Lakewood High School, and Our Lady Of Fatima Catholic School.
Ownership History
Date
Name
Owned For
Owner Type
Purchase Details
Closed on
Nov 5, 2021
Sold by
Vaughan Melvyn
Bought by
Hart Terrence Williams
Current Estimated Value
Home Financials for this Owner
Home Financials are based on the most recent Mortgage that was taken out on this home.
Original Mortgage
$400,000
Outstanding Balance
$366,531
Interest Rate
2.99%
Mortgage Type
Unknown
Estimated Equity
$209,959
Purchase Details
Closed on
Jun 8, 2009
Sold by
Lowe Kaplan Gail
Bought by
Lowe Kaplan Gail and Soule Sharon
Purchase Details
Closed on
Feb 27, 2009
Sold by
Lowe Kaplan Gaye and Soule Sharon
Bought by
Vaughan Melvyn
Home Financials for this Owner
Home Financials are based on the most recent Mortgage that was taken out on this home.
Original Mortgage
$198,750
Interest Rate
5.16%
Mortgage Type
Purchase Money Mortgage
Purchase Details
Closed on
Dec 3, 2008
Sold by
Lowe Kaplan Gaye
Bought by
Lowe Kaplan Gaye and Soule Sharon
Create a Home Valuation Report for This Property
The Home Valuation Report is an in-depth analysis detailing your home's value as well as a comparison with similar homes in the area
Home Values in the Area
Average Home Value in this Area
Purchase History
| Date | Buyer | Sale Price | Title Company |
|---|---|---|---|
| Hart Terrence Williams | $425,000 | Chicago Title | |
| Lowe Kaplan Gail | -- | None Available | |
| Vaughan Melvyn | $265,000 | None Available | |
| Lowe Kaplan Gaye | -- | None Available | |
| Lowe Kaplan Gaye | -- | None Available |
Source: Public Records
Mortgage History
| Date | Status | Borrower | Loan Amount |
|---|---|---|---|
| Open | Hart Terrence Williams | $400,000 | |
| Previous Owner | Vaughan Melvyn | $198,750 |
Source: Public Records
Tax History Compared to Growth
Tax History
| Year | Tax Paid | Tax Assessment Tax Assessment Total Assessment is a certain percentage of the fair market value that is determined by local assessors to be the total taxable value of land and additions on the property. | Land | Improvement |
|---|---|---|---|---|
| 2024 | $2,704 | $29,980 | $22,995 | $6,985 |
| 2023 | $2,704 | $29,980 | $22,995 | $6,985 |
| 2022 | $3,291 | $35,675 | $22,865 | $12,810 |
| 2021 | $3,338 | $36,701 | $23,523 | $13,178 |
| 2020 | $2,917 | $32,216 | $19,144 | $13,072 |
| 2019 | $2,880 | $32,216 | $19,144 | $13,072 |
| 2018 | $2,792 | $30,207 | $16,824 | $13,383 |
| 2017 | $2,453 | $30,207 | $16,824 | $13,383 |
| 2016 | $2,673 | $30,709 | $16,890 | $13,819 |
| 2015 | $2,299 | $30,709 | $16,890 | $13,819 |
| 2014 | $2,299 | $24,195 | $14,030 | $10,165 |
Source: Public Records
Map
Nearby Homes
- 2060 Hoyt St
- 1991 Glen Garry Dr
- 9306 W 13th Place
- 1390 Everett Ct Unit 111
- 9580 W 12th Place
- 16 Lakewood Heights Dr
- 1165 Independence St
- 2295 Estes St
- 10040 W 13th Place
- 1390 Lewis St
- 2451 Kipling St Unit 214
- 2451 Kipling St Unit 201
- 1350 Lewis St
- 1101 Pikeview St
- 2580 Hoyt St
- 2490 Lewis St
- 2450 Miller St
- 2005 Nelson St
- 9955 W 10th Ave
- 10185 W 25th Ave Unit 29