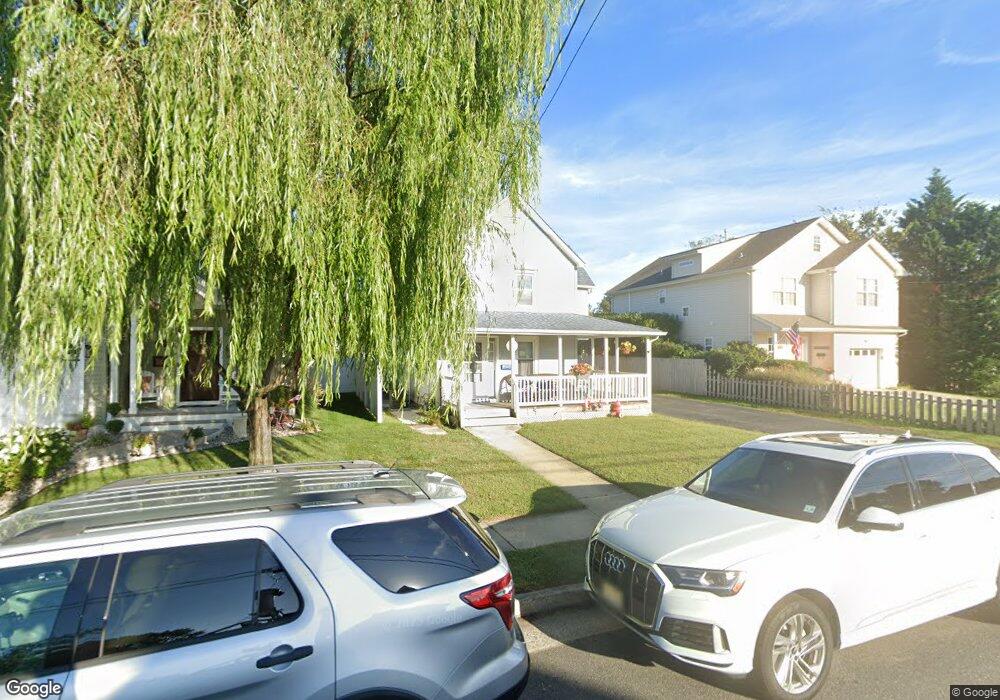
1720 I St Wall Township, NJ 07719
Estimated Value: $496,000 - $688,000
3
Beds
2
Baths
1,284
Sq Ft
$469/Sq Ft
Est. Value
About This Home
This home is located at 1720 I St, Wall Township, NJ 07719 and is currently estimated at $601,840, approximately $468 per square foot. 1720 I St is a home located in Monmouth County with nearby schools including Wall High School, St. Rose Grammar School, and St Rose High School.
Ownership History
Date
Name
Owned For
Owner Type
Purchase Details
Closed on
Nov 8, 1999
Sold by
Dicomo Mildred
Bought by
Ferguson Daniel and Ferguson Roseann
Current Estimated Value
Home Financials for this Owner
Home Financials are based on the most recent Mortgage that was taken out on this home.
Original Mortgage
$131,500
Interest Rate
7.73%
Mortgage Type
VA
Purchase Details
Closed on
Aug 5, 1997
Sold by
Sculthorpe Arthur
Bought by
Wolfe Jerry and Wolfe Amy
Home Financials for this Owner
Home Financials are based on the most recent Mortgage that was taken out on this home.
Original Mortgage
$70,000
Interest Rate
7.5%
Create a Home Valuation Report for This Property
The Home Valuation Report is an in-depth analysis detailing your home's value as well as a comparison with similar homes in the area
Home Values in the Area
Average Home Value in this Area
Purchase History
| Date | Buyer | Sale Price | Title Company |
|---|---|---|---|
| Ferguson Daniel | $128,000 | -- | |
| Wolfe Jerry | $70,000 | -- |
Source: Public Records
Mortgage History
| Date | Status | Borrower | Loan Amount |
|---|---|---|---|
| Previous Owner | Ferguson Daniel | $131,500 | |
| Previous Owner | Wolfe Jerry | $70,000 |
Source: Public Records
Tax History Compared to Growth
Tax History
| Year | Tax Paid | Tax Assessment Tax Assessment Total Assessment is a certain percentage of the fair market value that is determined by local assessors to be the total taxable value of land and additions on the property. | Land | Improvement |
|---|---|---|---|---|
| 2025 | $5,880 | $274,500 | $169,300 | $105,200 |
| 2024 | $5,734 | $274,500 | $169,300 | $105,200 |
| 2023 | $5,734 | $274,500 | $169,300 | $105,200 |
| 2022 | $5,556 | $274,500 | $169,300 | $105,200 |
| 2021 | $5,556 | $274,500 | $169,300 | $105,200 |
| 2020 | $5,485 | $274,500 | $169,300 | $105,200 |
| 2019 | $5,421 | $274,500 | $169,300 | $105,200 |
| 2018 | $5,361 | $274,500 | $169,300 | $105,200 |
| 2017 | $5,254 | $274,500 | $169,300 | $105,200 |
| 2016 | $5,558 | $297,700 | $169,300 | $128,400 |
| 2015 | $4,653 | $156,300 | $72,300 | $84,000 |
| 2014 | $4,458 | $153,300 | $69,300 | $84,000 |
Source: Public Records
Map
Nearby Homes