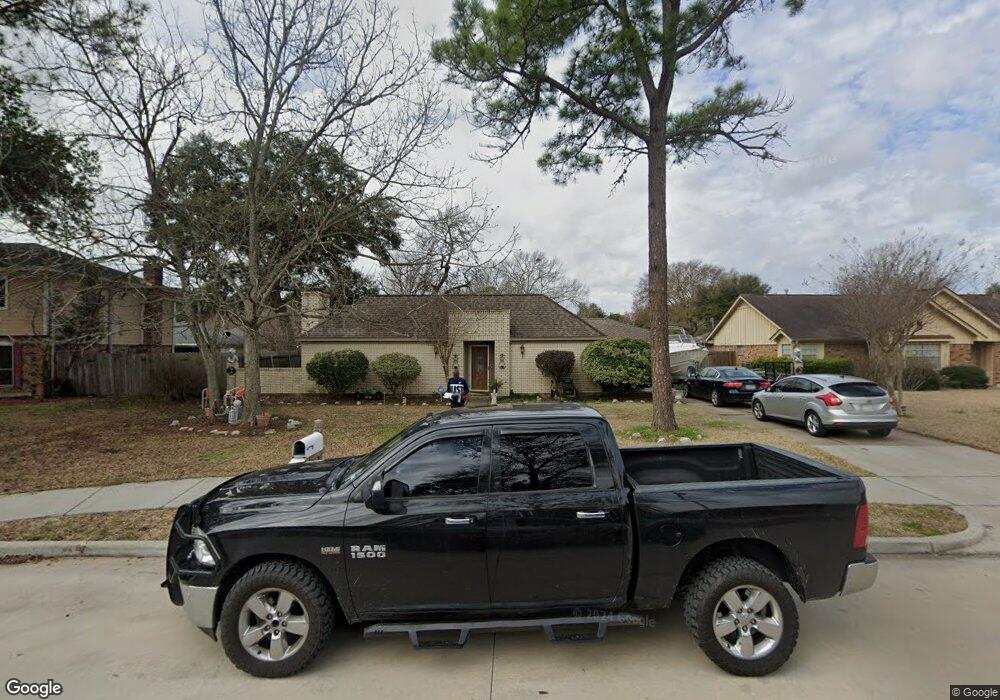
1720 Magnolia Ln Richmond, TX 77469
Estimated Value: $279,916 - $324,000
3
Beds
2
Baths
2,382
Sq Ft
$129/Sq Ft
Est. Value
About This Home
This home is located at 1720 Magnolia Ln, Richmond, TX 77469 and is currently estimated at $306,979, approximately $128 per square foot. 1720 Magnolia Ln is a home located in Fort Bend County with nearby schools including Smith Elementary School, J J Wessendorff Middle School, and Lamar Junior High School.
Ownership History
Date
Name
Owned For
Owner Type
Purchase Details
Closed on
Mar 22, 2013
Sold by
May Charlie M and May Brenda F
Bought by
Fisher Willie
Current Estimated Value
Home Financials for this Owner
Home Financials are based on the most recent Mortgage that was taken out on this home.
Original Mortgage
$132,000
Outstanding Balance
$93,360
Interest Rate
3.59%
Mortgage Type
VA
Estimated Equity
$213,619
Purchase Details
Closed on
Jun 21, 2006
Sold by
Weatherred Preston A and Weatherred Carole D
Bought by
May Charlie M and May Brenda F
Home Financials for this Owner
Home Financials are based on the most recent Mortgage that was taken out on this home.
Original Mortgage
$27,900
Interest Rate
6.63%
Mortgage Type
Stand Alone Second
Purchase Details
Closed on
Apr 19, 1984
Sold by
Zwahr George Eta
Bought by
Fisher Willie
Create a Home Valuation Report for This Property
The Home Valuation Report is an in-depth analysis detailing your home's value as well as a comparison with similar homes in the area
Home Values in the Area
Average Home Value in this Area
Purchase History
| Date | Buyer | Sale Price | Title Company |
|---|---|---|---|
| Fisher Willie | -- | Startex Title Co Llc | |
| May Charlie M | -- | First American Title | |
| Fisher Willie | -- | -- | |
| Fisher Willie | -- | -- |
Source: Public Records
Mortgage History
| Date | Status | Borrower | Loan Amount |
|---|---|---|---|
| Open | Fisher Willie | $132,000 | |
| Previous Owner | Fisher Willie | $27,900 | |
| Previous Owner | Fisher Willie | $111,600 |
Source: Public Records
Tax History Compared to Growth
Tax History
| Year | Tax Paid | Tax Assessment Tax Assessment Total Assessment is a certain percentage of the fair market value that is determined by local assessors to be the total taxable value of land and additions on the property. | Land | Improvement |
|---|---|---|---|---|
| 2025 | -- | $280,645 | $28,600 | $252,045 |
| 2024 | -- | $285,086 | $28,600 | $256,486 |
| 2023 | $0 | $260,216 | $0 | $289,627 |
| 2022 | $0 | $236,560 | $0 | $244,060 |
| 2021 | $5,107 | $215,050 | $22,000 | $193,050 |
| 2020 | $4,951 | $205,420 | $22,000 | $183,420 |
| 2019 | $5,235 | $204,980 | $22,000 | $182,980 |
| 2018 | $5,298 | $206,210 | $22,000 | $184,210 |
| 2017 | $5,102 | $196,290 | $18,500 | $177,790 |
| 2016 | $4,804 | $184,850 | $18,500 | $166,350 |
| 2015 | $3,645 | $172,610 | $18,500 | $154,110 |
| 2014 | $3,645 | $163,240 | $18,500 | $144,740 |
Source: Public Records
Map
Nearby Homes
- 1809 Hawthorn Dr
- 1805 Hawthorn Dr
- 1806 Cedar Dr
- 1109 Frances Dr
- 1922 Teakwood St
- 1004 Country Club Dr
- 4502 River Rd
- 2015 Tanglelane St
- 0 Meadow Ln
- 0 Fm 2218 Unit 25550047
- 512 and 514 Travis St
- 805 Chateau Place
- 4602 Avenue H
- 000 Fm 2218 Rd
- 2001 Briar Ln
- 6219 Deep Gulch Dr
- 6215 Deep Gulch Dr
- 6218 Deep Gulch Dr
- 606 Fannin St
- 400 Hillcrest Dr
- 1718 Magnolia Ln
- 1722 Magnolia Ln
- 1619 Cedar Dr
- 1802 Mulberry Dr
- 1615 Cedar Dr
- 1711 Magnolia Ln
- 1716 Magnolia Ln
- 1613 Cedar Dr
- 1800 Mulberry Dr
- 1714 Magnolia Ln
- 1809 Mulberry Dr
- 1709 Magnolia Ln
- 1712 Magnolia Ln
- 1803 Mulberry Dr
- 1611 Cedar Dr
- 1708 Mulberry Dr
- 1612 Cedar Dr
- 1710 Magnolia Ln
- 1801 Mulberry Dr
- 1608 Cedar Dr