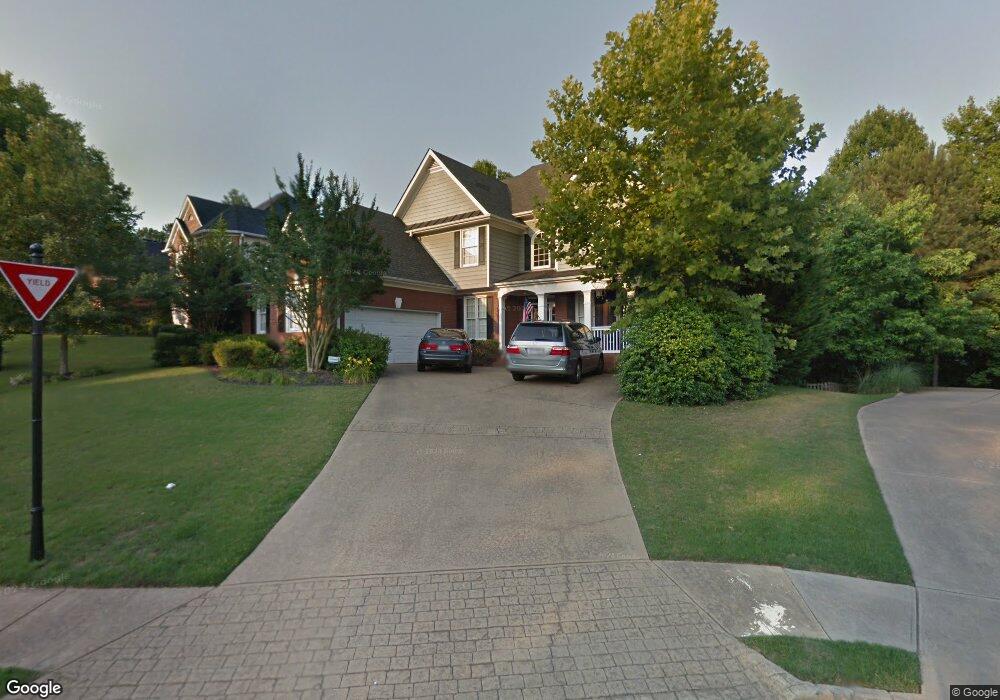
1720 Millside Terrace Dacula, GA 30019
Estimated Value: $651,933 - $727,000
5
Beds
4
Baths
3,117
Sq Ft
$222/Sq Ft
Est. Value
About This Home
This home is located at 1720 Millside Terrace, Dacula, GA 30019 and is currently estimated at $691,483, approximately $221 per square foot. 1720 Millside Terrace is a home located in Gwinnett County with nearby schools including Puckett's Mill Elementary School, Frank N. Osborne Middle School, and Mill Creek High School.
Ownership History
Date
Name
Owned For
Owner Type
Purchase Details
Closed on
Mar 9, 2001
Sold by
Basile William J
Bought by
Basile William J and Basile Kelli L
Current Estimated Value
Home Financials for this Owner
Home Financials are based on the most recent Mortgage that was taken out on this home.
Original Mortgage
$262,000
Outstanding Balance
$93,018
Interest Rate
7.02%
Mortgage Type
New Conventional
Estimated Equity
$598,465
Purchase Details
Closed on
Jul 19, 1999
Sold by
Jenkins & Willis Custom Homes In
Bought by
Cauley Edgar J and Cauley Shelley M
Home Financials for this Owner
Home Financials are based on the most recent Mortgage that was taken out on this home.
Original Mortgage
$259,900
Interest Rate
7.51%
Mortgage Type
New Conventional
Create a Home Valuation Report for This Property
The Home Valuation Report is an in-depth analysis detailing your home's value as well as a comparison with similar homes in the area
Home Values in the Area
Average Home Value in this Area
Purchase History
| Date | Buyer | Sale Price | Title Company |
|---|---|---|---|
| Basile William J | -- | -- | |
| Basile William J | $327,500 | -- | |
| Cauley Edgar J | $279,500 | -- |
Source: Public Records
Mortgage History
| Date | Status | Borrower | Loan Amount |
|---|---|---|---|
| Open | Basile William J | $262,000 | |
| Previous Owner | Cauley Edgar J | $259,900 |
Source: Public Records
Tax History Compared to Growth
Tax History
| Year | Tax Paid | Tax Assessment Tax Assessment Total Assessment is a certain percentage of the fair market value that is determined by local assessors to be the total taxable value of land and additions on the property. | Land | Improvement |
|---|---|---|---|---|
| 2025 | $7,043 | $263,480 | $59,840 | $203,640 |
| 2024 | $7,105 | $256,160 | $45,600 | $210,560 |
| 2023 | $7,105 | $234,760 | $45,600 | $189,160 |
| 2022 | $6,100 | $208,680 | $40,400 | $168,280 |
| 2021 | $5,143 | $158,280 | $27,200 | $131,080 |
| 2020 | $5,180 | $158,280 | $27,200 | $131,080 |
| 2019 | $5,033 | $158,280 | $27,200 | $131,080 |
| 2018 | $4,775 | $145,880 | $27,200 | $118,680 |
| 2016 | $4,642 | $138,720 | $24,000 | $114,720 |
| 2015 | $4,406 | $125,920 | $22,800 | $103,120 |
| 2014 | -- | $125,920 | $22,800 | $103,120 |
Source: Public Records
Map
Nearby Homes
- 2585 Millwater Crossing
- 1973 Hamilton Mill Pkwy
- 2455 Millwater Crossing
- 1872 Bakers Mill Rd
- 2405 Millwater Crossing
- 3222 Green Farm Trail
- 3177 Hog Mountain Rd
- 3349 Collier Point
- 1727 Bakers Mill Rd
- 3375 Fairway Bend Dr
- 1843 Hamilton Mill Pkwy
- 1770 Ridgemill Terrace
- 2070 Trinity Mill Dr
- 3969 Walkers Ridge Ct
- 3420 Millwater Crossing
- 3382 Fielders Point
- 3432 Fielders Point
- 1710 Millside Terrace
- 1730 Millside Terrace
- 1840 Sanborne Way
- 1830 Sanborne Way
- 1850 Sanborne Way
- 1740 Millside Terrace
- 1700 Millside Terrace
- 1820 Sanborne Way
- 1715 Millside Terrace
- 1715 Millside Terrace Unit 42
- 1860 Sanborne Way
- 1860 Sanborne Way Unit 35
- 1810 Sanborne Way
- 1705 Millside Terrace
- 0 Sanborne Way Unit 3210836
- 0 Sanborne Way Unit 3222907
- 0 Sanborne Way Unit 7198721
- 0 Sanborne Way Unit 7340165
- 0 Sanborne Way Unit 7370835
- 0 Sanborne Way Unit 7458521