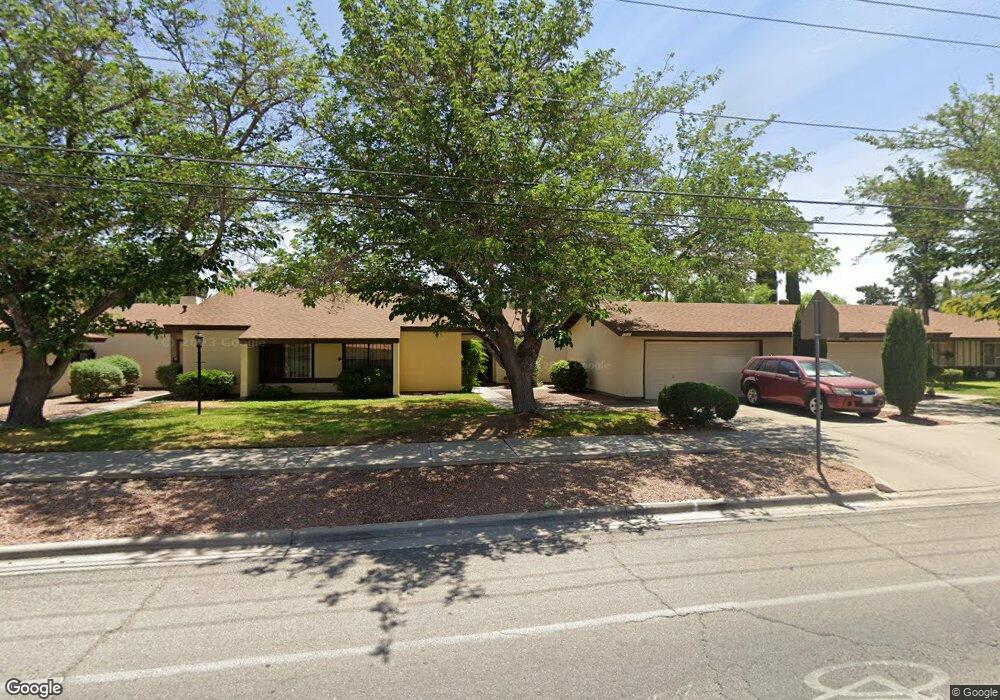
1720 Mosswood St El Paso, TX 79935
Vista Del Sol NeighborhoodEstimated Value: $194,160 - $223,000
2
Beds
2
Baths
1,316
Sq Ft
$155/Sq Ft
Est. Value
About This Home
This home is located at 1720 Mosswood St, El Paso, TX 79935 and is currently estimated at $204,540, approximately $155 per square foot. 1720 Mosswood St is a home located in El Paso County with nearby schools including Eastwood Heights Elementary School, Eastwood Middle School, and Eastwood High School.
Ownership History
Date
Name
Owned For
Owner Type
Purchase Details
Closed on
Sep 13, 2011
Sold by
Wilkins Louise L
Bought by
Clarke Luis Arturo and Clarke Guadalupe Najera
Current Estimated Value
Purchase Details
Closed on
Jan 18, 2008
Sold by
Le Tourneau Reginald J and Wilkins Louise L
Bought by
Wilkins Louise L
Purchase Details
Closed on
Oct 15, 1999
Sold by
Turley Clara Padilla
Bought by
Wilkins Louise L
Purchase Details
Closed on
Sep 15, 1998
Sold by
Goodman Henry P and Goodman Vicki A
Bought by
Turley Clara Padilla
Home Financials for this Owner
Home Financials are based on the most recent Mortgage that was taken out on this home.
Original Mortgage
$68,400
Interest Rate
9.99%
Purchase Details
Closed on
Dec 12, 1997
Sold by
Fromer Jimmie Sue
Bought by
Goodman Henry P and Goodman Vicki A
Purchase Details
Closed on
Jul 21, 1997
Sold by
Larkin Raymond M and Price Alice L
Bought by
Worst R Howard and Fromer Jimmie Sue
Create a Home Valuation Report for This Property
The Home Valuation Report is an in-depth analysis detailing your home's value as well as a comparison with similar homes in the area
Home Values in the Area
Average Home Value in this Area
Purchase History
| Date | Buyer | Sale Price | Title Company |
|---|---|---|---|
| Clarke Luis Arturo | -- | None Available | |
| Wilkins Louise L | -- | None Available | |
| Wilkins Louise L | -- | -- | |
| Turley Clara Padilla | -- | -- | |
| Goodman Henry P | -- | -- | |
| Worst R Howard | -- | -- |
Source: Public Records
Mortgage History
| Date | Status | Borrower | Loan Amount |
|---|---|---|---|
| Previous Owner | Turley Clara Padilla | $68,400 |
Source: Public Records
Tax History Compared to Growth
Tax History
| Year | Tax Paid | Tax Assessment Tax Assessment Total Assessment is a certain percentage of the fair market value that is determined by local assessors to be the total taxable value of land and additions on the property. | Land | Improvement |
|---|---|---|---|---|
| 2025 | $5,338 | $221,103 | $26,869 | $194,234 |
| 2024 | $5,338 | $207,612 | $26,869 | $180,743 |
| 2023 | $5,338 | $161,952 | $23,282 | $138,670 |
| 2022 | $5,029 | $161,952 | $23,282 | $138,670 |
| 2021 | $4,719 | $145,164 | $23,282 | $121,882 |
| 2020 | $4,442 | $140,636 | $23,282 | $117,354 |
| 2018 | $4,314 | $138,721 | $23,282 | $115,439 |
| 2017 | $4,240 | $138,721 | $23,282 | $115,439 |
| 2016 | $4,240 | $138,721 | $23,282 | $115,439 |
| 2015 | $3,969 | $138,721 | $23,282 | $115,439 |
| 2014 | $3,969 | $138,721 | $23,282 | $115,439 |
Source: Public Records
Map
Nearby Homes
- 1909 Crow Dr
- 10313 Byway Dr
- 10233 Byway Dr
- 10533 Springwood Dr
- 2105 Pacheco Dr
- 10304 Woodruff Ct
- 2109 Febrero Dr
- 10309 Woodruff Ct
- 1730 Bara Dr
- 2224 Escarpa Dr
- 1644 Lomaland Dr Unit 169
- 10463 Davwood Ln
- 1649 Lomaland Dr
- 2153 Trawood Dr
- 2000 Solano Dr
- 2201 Trawood Dr
- 10481 Deepwood Ct
- 10512 Album Ave
- 2412 Penwood Dr
- 10617 Candlewood Ave
- 1716 Mosswood St
- 1724 Mosswood St
- 10651 Park View Cir
- 10651 Park View Cir Unit 1
- 1712 Mosswood St
- 1728 Mosswood St
- 10653 Park View Cir
- 10649 Park View Cir
- 10647 Park View Cir
- 10657 Park View Cir
- 10657 Park View Cir Unit 1
- 10634 Park View Cir
- 10635 Park View Cir
- 10637 Park View Cir
- 10654 Park View Cir
- 10658 Park View Cir
- 10639 Park View Cir
- 10652 Park View Cir
- 10656 Park View Cir
- 10656 Park View Cir Unit 1