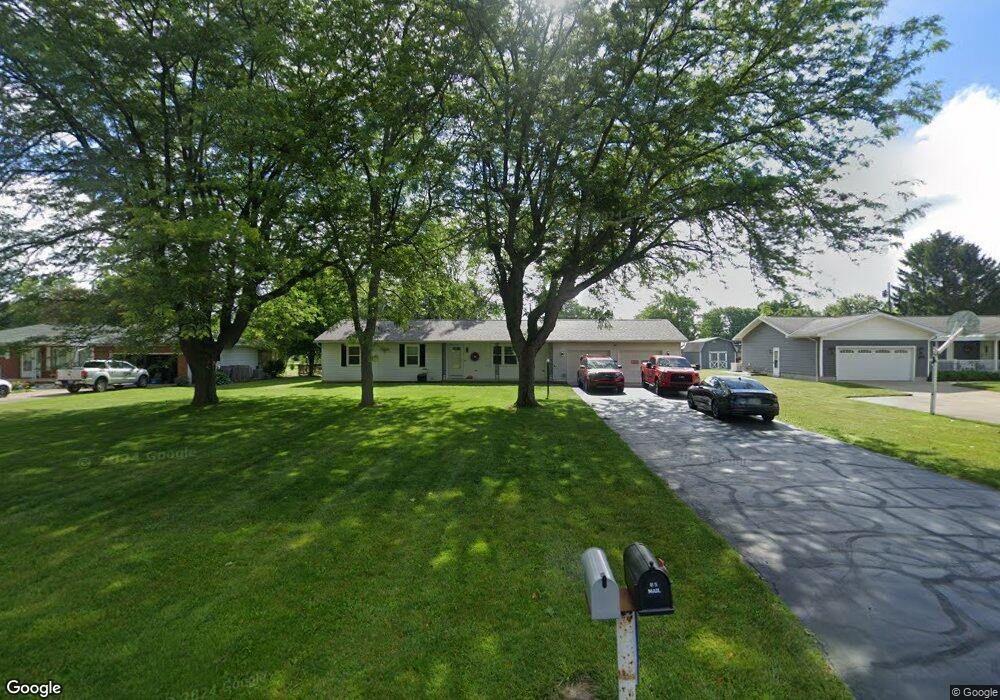
1720 N Union St Fostoria, OH 44830
Estimated Value: $165,000 - $211,000
3
Beds
2
Baths
1,492
Sq Ft
$127/Sq Ft
Est. Value
About This Home
This home is located at 1720 N Union St, Fostoria, OH 44830 and is currently estimated at $189,936, approximately $127 per square foot. 1720 N Union St is a home located in Seneca County with nearby schools including Fostoria Intermediate Elementary School and Fostoria Junior/Senior High School.
Ownership History
Date
Name
Owned For
Owner Type
Purchase Details
Closed on
May 14, 2020
Sold by
Haman Nicholas
Bought by
Hoff Tyler E
Current Estimated Value
Home Financials for this Owner
Home Financials are based on the most recent Mortgage that was taken out on this home.
Original Mortgage
$47,000
Outstanding Balance
$32,875
Interest Rate
3.3%
Mortgage Type
New Conventional
Estimated Equity
$157,061
Purchase Details
Closed on
Nov 13, 2009
Sold by
Salazar Sylvia S
Bought by
Haman Nicholas
Home Financials for this Owner
Home Financials are based on the most recent Mortgage that was taken out on this home.
Original Mortgage
$70,875
Interest Rate
4.95%
Mortgage Type
Purchase Money Mortgage
Purchase Details
Closed on
Dec 1, 2003
Sold by
Salazar Sylvia S
Bought by
Salazar Sylvia S
Purchase Details
Closed on
May 10, 1991
Sold by
Bolen Norman R and Bolen Doris M
Bought by
Bolen Norman R Trust Norman R
Create a Home Valuation Report for This Property
The Home Valuation Report is an in-depth analysis detailing your home's value as well as a comparison with similar homes in the area
Home Values in the Area
Average Home Value in this Area
Purchase History
| Date | Buyer | Sale Price | Title Company |
|---|---|---|---|
| Hoff Tyler E | $117,000 | Legacy Title Llc | |
| Haman Nicholas | $94,500 | None Available | |
| Salazar Sylvia S | $66,500 | -- | |
| Bolen Norman R Trust Norman R | -- | -- |
Source: Public Records
Mortgage History
| Date | Status | Borrower | Loan Amount |
|---|---|---|---|
| Open | Hoff Tyler E | $47,000 | |
| Previous Owner | Haman Nicholas | $70,875 |
Source: Public Records
Tax History Compared to Growth
Tax History
| Year | Tax Paid | Tax Assessment Tax Assessment Total Assessment is a certain percentage of the fair market value that is determined by local assessors to be the total taxable value of land and additions on the property. | Land | Improvement |
|---|---|---|---|---|
| 2024 | $2,118 | $45,070 | $6,560 | $38,510 |
| 2023 | $2,082 | $44,270 | $6,560 | $37,710 |
| 2022 | $1,899 | $34,960 | $5,670 | $29,290 |
| 2021 | $1,848 | $34,960 | $5,670 | $29,290 |
| 2020 | $1,858 | $34,955 | $5,667 | $29,288 |
| 2019 | $1,755 | $32,914 | $5,467 | $27,447 |
| 2018 | $1,784 | $32,914 | $5,467 | $27,447 |
| 2017 | $1,782 | $32,914 | $5,467 | $27,447 |
| 2016 | $1,624 | $30,398 | $5,418 | $24,980 |
| 2015 | $1,593 | $30,398 | $5,418 | $24,980 |
| 2014 | $1,488 | $30,398 | $5,418 | $24,980 |
| 2013 | $1,773 | $33,041 | $5,891 | $27,150 |
Source: Public Records
Map
Nearby Homes
- 375 Thomas St
- 1324 N Union St
- 727 Eisenhower Dr
- 900 N Countyline St
- 892 N Countyline St
- 931 N Union St
- 901 Central Ave
- 827 Buckley St
- 633 Maple St
- 723 N Union St
- 711 Circle Dr
- 520 N Union St
- 540 N Poplar St
- 220 E High St
- 481 Beverly Dr
- 509 College Ave
- 203 N Union St
- 425 W Ridge Dr Unit U5
- 1401 Van Buren St Unit U24
- 1401 Van Buren St Unit U21
- 1730 N Union St
- 1708 N Union St
- 1734 N Union St
- 1706 N Union St
- 1713 Walnut St
- 1709 Walnut St
- 1733 N Union St
- 1717 N Union St
- 1707 Walnut St
- 1715 Walnut St
- 1744 N Union St
- 1704 N Union St
- 1745 N Union St
- 1705 Walnut St
- 1717 Walnut St
- 1705 N Union St
- 1705 N Union St
- 1703 N Union St
- 1702 N Union St
- 1748 N Union St