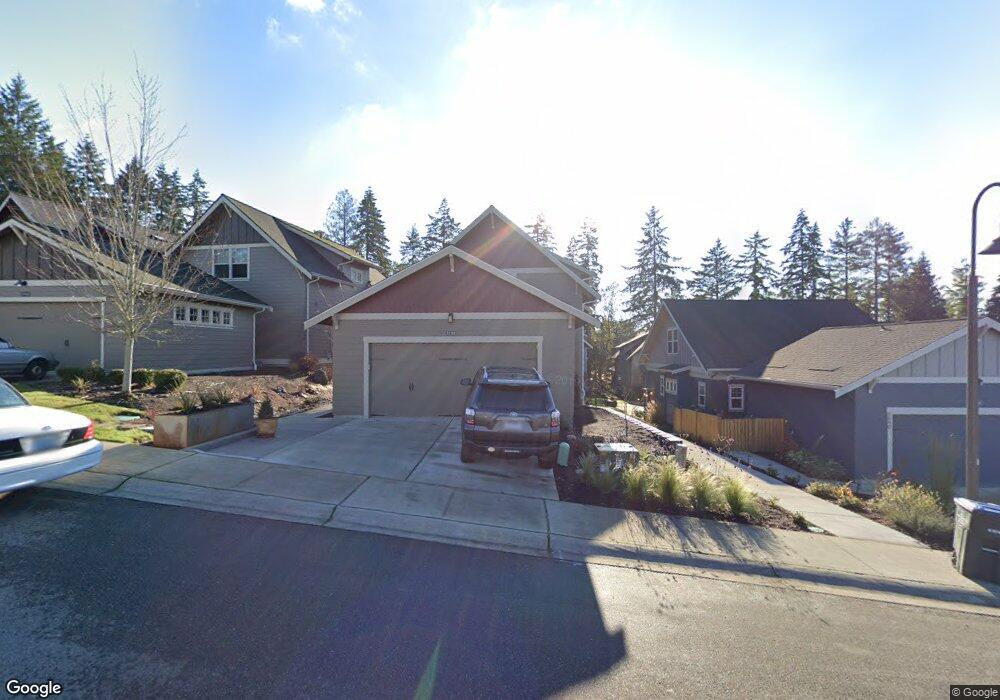
1720 NE Nutkana Way Poulsbo, WA 98370
Estimated Value: $658,000 - $669,000
3
Beds
2
Baths
2,096
Sq Ft
$316/Sq Ft
Est. Value
About This Home
This home is located at 1720 NE Nutkana Way, Poulsbo, WA 98370 and is currently estimated at $662,447, approximately $316 per square foot. 1720 NE Nutkana Way is a home located in Kitsap County with nearby schools including Poulsbo Elementary School, Poulsbo Middle School, and North Kitsap High School.
Ownership History
Date
Name
Owned For
Owner Type
Purchase Details
Closed on
Jul 17, 2017
Sold by
Kaltenbach Charles M and Kaltenbach Shirley A
Bought by
Kaltenbach Charles Martin and Kaltenbach Shirley Ann
Current Estimated Value
Purchase Details
Closed on
May 11, 2017
Sold by
Sb Development Llc
Bought by
Kaltenbach Charles M and Kaltenbach Shirley A
Home Financials for this Owner
Home Financials are based on the most recent Mortgage that was taken out on this home.
Original Mortgage
$300,000
Interest Rate
4.02%
Mortgage Type
New Conventional
Purchase Details
Closed on
Dec 8, 2015
Sold by
Snowberry Enterprises Llc
Bought by
Sb Development Llc
Create a Home Valuation Report for This Property
The Home Valuation Report is an in-depth analysis detailing your home's value as well as a comparison with similar homes in the area
Home Values in the Area
Average Home Value in this Area
Purchase History
| Date | Buyer | Sale Price | Title Company |
|---|---|---|---|
| Kaltenbach Charles Martin | $281 | None Available | |
| Kaltenbach Charles M | $424,990 | Chicago Title | |
| Sb Development Llc | $1,168,000 | Pacific Nw Title |
Source: Public Records
Mortgage History
| Date | Status | Borrower | Loan Amount |
|---|---|---|---|
| Previous Owner | Kaltenbach Charles M | $300,000 |
Source: Public Records
Tax History Compared to Growth
Tax History
| Year | Tax Paid | Tax Assessment Tax Assessment Total Assessment is a certain percentage of the fair market value that is determined by local assessors to be the total taxable value of land and additions on the property. | Land | Improvement |
|---|---|---|---|---|
| 2026 | $5,377 | $599,170 | $103,520 | $495,650 |
| 2025 | $5,377 | $599,170 | $103,520 | $495,650 |
| 2024 | $4,908 | $563,230 | $96,800 | $466,430 |
| 2023 | $4,992 | $563,230 | $96,800 | $466,430 |
| 2022 | $4,451 | $477,520 | $84,030 | $393,490 |
| 2021 | $4,324 | $429,880 | $75,290 | $354,590 |
| 2020 | $4,543 | $443,790 | $71,930 | $371,860 |
| 2019 | $4,277 | $417,680 | $67,220 | $350,460 |
| 2018 | $4,146 | $87,860 | $51,000 | $36,860 |
| 2017 | $1,011 | $87,860 | $51,000 | $36,860 |
| 2016 | $638 | $87,860 | $51,000 | $36,860 |
| 2015 | $635 | $51,000 | $51,000 | $0 |
| 2014 | -- | $51,000 | $51,000 | $0 |
| 2013 | -- | $51,000 | $51,000 | $0 |
Source: Public Records
Map
Nearby Homes
- 1776 Bungalow Way NE
- 1754 NE Mesford Rd Unit 74
- 29 Beargrass Ln NE
- 35 Beargrass Ln NE
- 19546 23rd Ave NE
- 2776 NE Noll Valley Loop
- 123 Pugh Rd NE
- 456 Little Valley Rd NE
- 20156 Vikings Crest NE Unit 7-304
- 20161 Vikings Crest Loop NE Unit 5-106
- 20050 Vikings Crest Loop NE Unit 2-301
- 20026 Vikings Crest NE Unit 1-102
- 19795 4th Ave NE
- 19680 Noll Rd NE
- 0 Bond Rd NE
- 0 7th Ave NE Unit NWM2459196
- 0 7th Ave NE Unit NWM2280996
- 20056 Lysir Ct NE
- 19463 Scoter Ln NE
- 19458 Jensen Way NE
- 1690 NE Nutkana Way Unit 4
- 1690 NE Nutkana Way
- 1760 NE Nutkana Way
- 1680 NE Nutkana Way Unit 3
- 1680 NE Nutkana Way Unit Lot 3
- 1680 NE Nutkana Way
- 17 Nutkana Way Unit Lot17
- 15 Nutkana Way Unit Lot15
- 14 Nutkana Way Unit Lot14
- 13 Nutkana Way Unit Lot13
- 1660 NE Nutkana Way Unit 2
- 1660 NE Nutkana Way Unit Lot 2
- 1660 NE Nutkana Way
- 1721 NE Nutkana Way
- 1723 Bungalow Way NE
- 1747 Bungalow Way NE
- 1765 Bungalow Way NE
- 1650 NE Nutkana Way Unit 1
- 1650 NE Nutkana Way Unit Lot 1
- 1650 NE Nutkana Way