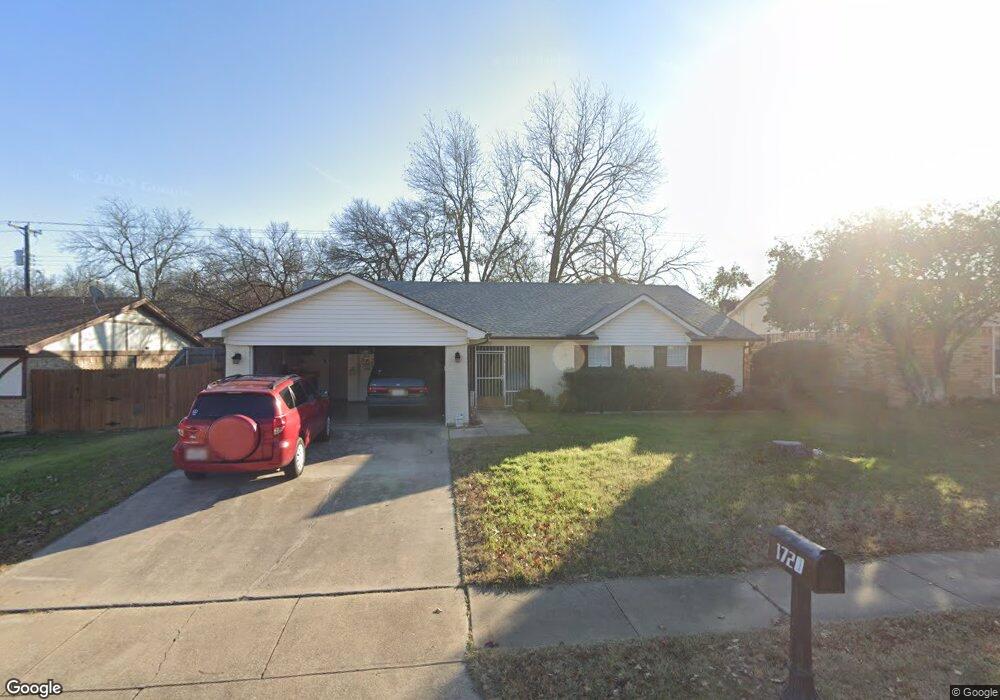
1720 Post Oak Dr Bedford, TX 76021
Estimated Value: $367,310 - $391,000
3
Beds
2
Baths
1,692
Sq Ft
$223/Sq Ft
Est. Value
About This Home
This home is located at 1720 Post Oak Dr, Bedford, TX 76021 and is currently estimated at $377,828, approximately $223 per square foot. 1720 Post Oak Dr is a home located in Tarrant County with nearby schools including Spring Garden Elementary School, Harwood Junior High School, and Trinity High School.
Ownership History
Date
Name
Owned For
Owner Type
Purchase Details
Closed on
Jan 11, 2019
Sold by
Nelson Donald
Bought by
Taylor Martin Eric and Taylor Detsy Elena
Current Estimated Value
Home Financials for this Owner
Home Financials are based on the most recent Mortgage that was taken out on this home.
Original Mortgage
$248,000
Outstanding Balance
$218,919
Interest Rate
4.8%
Mortgage Type
VA
Estimated Equity
$158,909
Purchase Details
Closed on
Jul 12, 2018
Sold by
Dallas Metro Holdings Llc
Bought by
Creek Homes Llc
Purchase Details
Closed on
Feb 28, 2008
Sold by
Tromanhauser William G and Tromanhauser Patricia
Bought by
Winters Phillip L and Winters Connie
Home Financials for this Owner
Home Financials are based on the most recent Mortgage that was taken out on this home.
Original Mortgage
$147,606
Interest Rate
5.72%
Mortgage Type
VA
Create a Home Valuation Report for This Property
The Home Valuation Report is an in-depth analysis detailing your home's value as well as a comparison with similar homes in the area
Home Values in the Area
Average Home Value in this Area
Purchase History
| Date | Buyer | Sale Price | Title Company |
|---|---|---|---|
| Taylor Martin Eric | -- | None Available | |
| Creek Homes Llc | -- | None Available | |
| Dallas Metro Holdings Llc | -- | Sendera Title | |
| Winters Phillip L | -- | First American Title |
Source: Public Records
Mortgage History
| Date | Status | Borrower | Loan Amount |
|---|---|---|---|
| Open | Taylor Martin Eric | $248,000 | |
| Previous Owner | Winters Phillip L | $147,606 |
Source: Public Records
Tax History
| Year | Tax Paid | Tax Assessment Tax Assessment Total Assessment is a certain percentage of the fair market value that is determined by local assessors to be the total taxable value of land and additions on the property. | Land | Improvement |
|---|---|---|---|---|
| 2025 | $3,247 | $389,048 | $75,000 | $314,048 |
| 2024 | $3,247 | $389,048 | $75,000 | $314,048 |
| 2023 | $6,136 | $348,869 | $45,000 | $303,869 |
| 2022 | $6,352 | $300,854 | $45,000 | $255,854 |
| 2021 | $6,228 | $264,374 | $45,000 | $219,374 |
| 2020 | $5,823 | $244,898 | $45,000 | $199,898 |
| 2019 | $5,990 | $246,577 | $45,000 | $201,577 |
| 2018 | $4,605 | $205,267 | $45,000 | $160,267 |
| 2017 | $4,514 | $209,480 | $35,000 | $174,480 |
| 2016 | $4,104 | $184,934 | $35,000 | $149,934 |
| 2015 | $3,246 | $169,869 | $35,000 | $134,869 |
| 2014 | $3,246 | $140,200 | $25,000 | $115,200 |
Source: Public Records
Map
Nearby Homes
- 1724 Post Oak Dr
- 1630 Post Oak Dr
- 17 Lincolnshire Cir
- 22 Lincolnshire Cir
- 21 Devonshire Dr
- 2901 Miles Way
- 2528 Sunshine Ct
- 2701 Clearmeadow Ct
- 1801 Glenbrook Ct
- 2109 Oakmeadow St
- 2505 Shady Ridge Dr
- 2912 Weslyan Oak St
- 1252 Royal Crescent Dr
- 3528 Meadowside Dr
- 1800 Hampton Dr
- 3 Dewberry Ct
- 2941 Eagles Nest Dr
- 2909 Oakridge Dr
- 104 Morrow Dr
- 1105 Springdale Rd
- 1720 Post Oaks Dr
- 1716 Post Oak Dr
- 1712 Post Oak Dr
- 1719 Post Oak Dr
- 1715 Post Oak Dr
- 2904 Bedfordshire
- 2900 Oak Valley Dr
- 1708 Post Oak Dr
- 2904 Oak Valley Dr
- 1711 Post Oak Dr
- 2908 Oak Valley Dr
- 65 Devonshire Dr
- 3004 Bramble Oaks Ct
- 50 Lincolnshire Cir
- 3000 Bramble Oaks Ct
- 3006 Bramble Oaks Ct
- 1704 Post Oak Dr
- 1707 Post Oak Dr
- 2912 Oak Valley Dr
- 2900 Bedfordshire
Your Personal Tour Guide
Ask me questions while you tour the home.