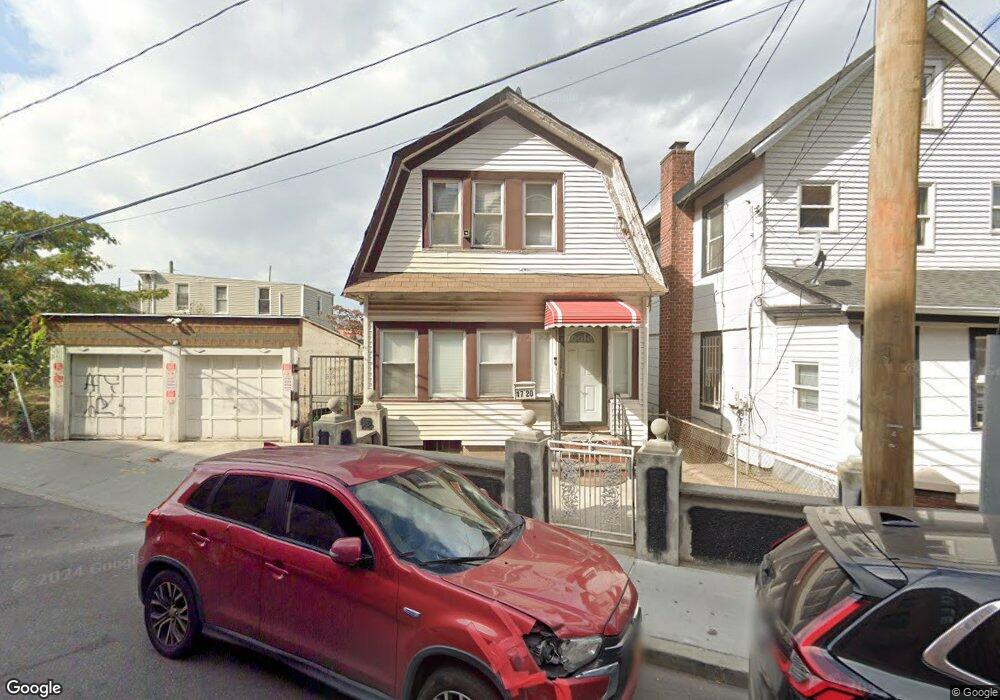
1720 Redfern Ave Far Rockaway, NY 11691
Far Rockaway NeighborhoodEstimated Value: $564,498 - $653,000
--
Bed
--
Bath
1,440
Sq Ft
$422/Sq Ft
Est. Value
About This Home
This home is located at 1720 Redfern Ave, Far Rockaway, NY 11691 and is currently estimated at $607,625, approximately $421 per square foot. 1720 Redfern Ave is a home located in Queens County with nearby schools including The Randolph Holder School for Social Justice - Q253, P.S. 253 The Magnet School of Multicultural Humanities, and Ms 53 Brian Piccolo.
Ownership History
Date
Name
Owned For
Owner Type
Purchase Details
Closed on
May 3, 2024
Sold by
Hunter Kelvin
Bought by
Candace Radford Hunter As Trustee and Kelvin Hunter As Trustee
Current Estimated Value
Purchase Details
Closed on
Dec 29, 2003
Sold by
Sade Eran
Bought by
Hunter Kelvin
Home Financials for this Owner
Home Financials are based on the most recent Mortgage that was taken out on this home.
Original Mortgage
$228,000
Interest Rate
5.88%
Mortgage Type
Purchase Money Mortgage
Purchase Details
Closed on
Jun 2, 2003
Sold by
Castor Carlo
Bought by
Sade Eran
Home Financials for this Owner
Home Financials are based on the most recent Mortgage that was taken out on this home.
Original Mortgage
$144,000
Interest Rate
6.02%
Mortgage Type
Purchase Money Mortgage
Create a Home Valuation Report for This Property
The Home Valuation Report is an in-depth analysis detailing your home's value as well as a comparison with similar homes in the area
Home Values in the Area
Average Home Value in this Area
Purchase History
| Date | Buyer | Sale Price | Title Company |
|---|---|---|---|
| Candace Radford Hunter As Trustee | -- | -- | |
| Candace Radford Hunter As Trustee | -- | -- | |
| Hunter Kelvin | $285,000 | -- | |
| Hunter Kelvin | $285,000 | -- | |
| Sade Eran | $160,000 | -- | |
| Sade Eran | $160,000 | -- |
Source: Public Records
Mortgage History
| Date | Status | Borrower | Loan Amount |
|---|---|---|---|
| Previous Owner | Hunter Kelvin | $28,500 | |
| Previous Owner | Hunter Kelvin | $228,000 | |
| Previous Owner | Sade Eran | $144,000 |
Source: Public Records
Tax History Compared to Growth
Tax History
| Year | Tax Paid | Tax Assessment Tax Assessment Total Assessment is a certain percentage of the fair market value that is determined by local assessors to be the total taxable value of land and additions on the property. | Land | Improvement |
|---|---|---|---|---|
| 2025 | $3,367 | $17,734 | $4,903 | $12,831 |
| 2024 | $3,367 | $16,765 | $5,554 | $11,211 |
| 2023 | $3,367 | $16,765 | $4,790 | $11,975 |
| 2022 | $3,312 | $28,320 | $9,720 | $18,600 |
| 2021 | $3,295 | $28,440 | $9,720 | $18,720 |
| 2020 | $3,128 | $24,480 | $9,720 | $14,760 |
| 2019 | $2,923 | $24,300 | $9,720 | $14,580 |
| 2018 | $2,848 | $13,971 | $5,427 | $8,544 |
| 2017 | $2,818 | $13,824 | $7,342 | $6,482 |
| 2016 | $2,608 | $13,824 | $7,342 | $6,482 |
| 2015 | $1,573 | $12,315 | $4,890 | $7,425 |
| 2014 | $1,573 | $11,643 | $4,763 | $6,880 |
Source: Public Records
Map
Nearby Homes
- 13-58 Pinson St
- 13-58 Chandler St
- 1120 Beach Channel Dr
- 14-15 Pinson St
- 1323 Mcbride St Unit 13-23B
- 1357 Mcbride St
- 14-03 Chandler St
- 22-80 Jaydee Ct
- 1442 Pinson St
- 14-11 Chandler St
- 1134 Mcbride St
- 2206 Regina Ave
- 1132 Mcbride St
- 1141 Mcbride St Unit 3B
- 2202 Loretta Rd
- 12-99 Brunswick Ave
- 2287 Mott Ave Unit 5F
- 10-26 Beach 22nd St
- 1431 Mcbride St
- 1325 Gipson St
- 1716 Redfern Ave
- 1716 Redfern Ave
- 2104 Dix Ave
- 2110 Dix Ave
- 1727 Redfern Ave
- 1725 Redfern Ave
- 2115 Birdsall Ave
- 1721 Redfern Ave
- 17-19 Redfern Ave
- 2107 Birdsall Ave
- 2117 Birdsall Ave
- 1719 Redfern Ave
- 1 Dix Ave
- 2101 Dix Ave
- 17-15 Redfern Ave
- 1354 Beach Channel Dr
- 1801 Redfern Ave
- 1715 Redfern Ave
- 2103 Dix Ave
- 2105 Dix Ave