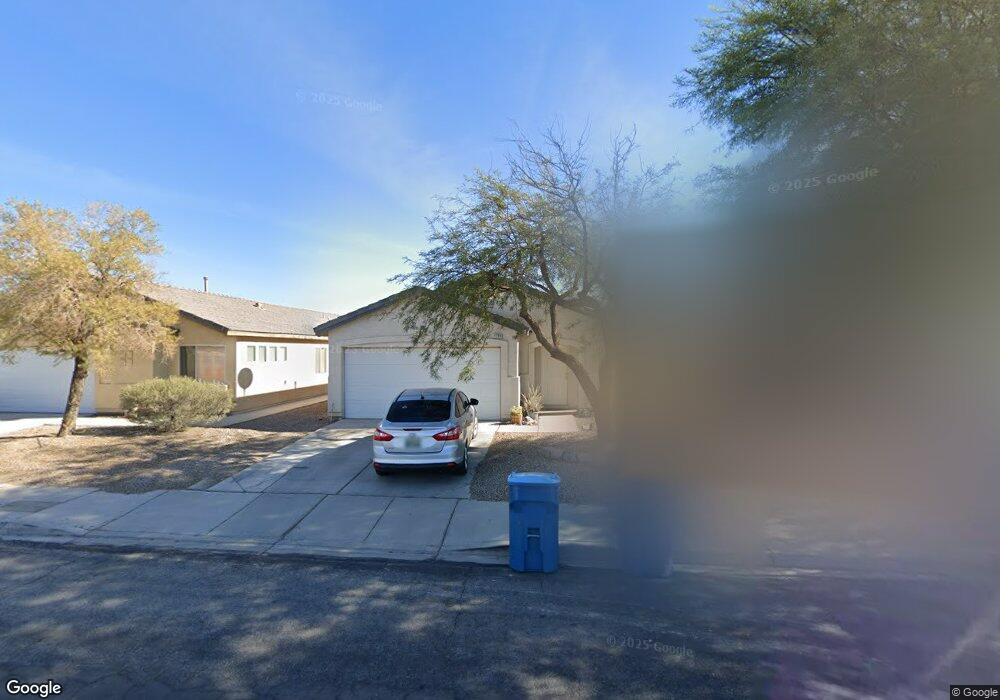
1720 Ringe Ln Las Vegas, NV 89156
Estimated Value: $327,311 - $371,000
3
Beds
2
Baths
1,163
Sq Ft
$303/Sq Ft
Est. Value
About This Home
This home is located at 1720 Ringe Ln, Las Vegas, NV 89156 and is currently estimated at $352,578, approximately $303 per square foot. 1720 Ringe Ln is a home located in Clark County with nearby schools including Mountain View Elementary School, Dr. William H. Bailey Middle School, and Sunrise Mountain High School.
Ownership History
Date
Name
Owned For
Owner Type
Purchase Details
Closed on
Dec 10, 2020
Sold by
King Edward Lee and King Edward L
Bought by
King Edward Lee and King Edward Lee
Current Estimated Value
Purchase Details
Closed on
Aug 28, 2003
Sold by
Mcghie Cody
Bought by
King Edward L
Home Financials for this Owner
Home Financials are based on the most recent Mortgage that was taken out on this home.
Original Mortgage
$131,000
Outstanding Balance
$59,220
Interest Rate
5.87%
Mortgage Type
Unknown
Estimated Equity
$293,358
Purchase Details
Closed on
Nov 20, 2001
Sold by
Hearthstone Homebuilders Inc
Bought by
Mcghie Cody
Home Financials for this Owner
Home Financials are based on the most recent Mortgage that was taken out on this home.
Original Mortgage
$116,166
Interest Rate
6.57%
Mortgage Type
FHA
Create a Home Valuation Report for This Property
The Home Valuation Report is an in-depth analysis detailing your home's value as well as a comparison with similar homes in the area
Home Values in the Area
Average Home Value in this Area
Purchase History
| Date | Buyer | Sale Price | Title Company |
|---|---|---|---|
| King Edward Lee | -- | None Available | |
| King Edward L | $139,000 | National Title Company | |
| Mcghie Cody | $117,990 | Land Title | |
| Mcghie Cody | -- | Lawyers Title |
Source: Public Records
Mortgage History
| Date | Status | Borrower | Loan Amount |
|---|---|---|---|
| Open | King Edward L | $131,000 | |
| Previous Owner | Mcghie Cody | $116,166 |
Source: Public Records
Tax History Compared to Growth
Tax History
| Year | Tax Paid | Tax Assessment Tax Assessment Total Assessment is a certain percentage of the fair market value that is determined by local assessors to be the total taxable value of land and additions on the property. | Land | Improvement |
|---|---|---|---|---|
| 2025 | $1,009 | $76,155 | $26,600 | $49,555 |
| 2024 | $935 | $76,155 | $26,600 | $49,555 |
| 2023 | $935 | $74,273 | $27,300 | $46,973 |
| 2022 | $866 | $64,826 | $22,050 | $42,776 |
| 2021 | $802 | $60,304 | $19,600 | $40,704 |
| 2020 | $742 | $60,008 | $19,600 | $40,408 |
| 2019 | $695 | $53,757 | $14,000 | $39,757 |
| 2018 | $663 | $49,396 | $11,200 | $38,196 |
| 2017 | $1,430 | $48,750 | $10,150 | $38,600 |
| 2016 | $622 | $38,704 | $7,350 | $31,354 |
| 2015 | $620 | $33,923 | $5,250 | $28,673 |
| 2014 | $601 | $19,865 | $4,200 | $15,665 |
Source: Public Records
Map
Nearby Homes
- 4541 E Owens Ave
- 1667 Rockwell Ln
- 5320 Meikle Ln
- 1385 Ringe Ln
- 1831 Castleberry Ln
- 0 Meikle Ln
- 5023 E Monroe Ave
- 2130 Trebbiano Way
- 4928 E Monroe Ave
- 2190 Clancy St
- 1654 Nesting Way
- 5280 Shreve Ave
- 5207 Paradise Valley Ave
- 5660 E Lake Mead Blvd
- 4932 E Washington Ave
- 2176 N Christy Ln
- 5383 E Washington Ave
- 4637 Baby Bird Ln
- 1919 Verde Mirada Dr
- 1139 Betty Ln
- 1726 Ringe Ln
- 1708 Ringe Ln
- 1721 Cozy Corner St
- 1715 Cozy Corner St
- 1727 Cozy Corner St
- 1702 Ringe Ln
- 1709 Cozy Corner St
- 1703 Cozy Corner St
- 1696 Ringe Ln
- 1697 Cozy Corner St
- 1690 Ringe Ln
- 1691 Cozy Corner St
- 1722 Cozy Corner St
- 1684 Ringe Ln
- 1710 Cozy Corner St
- 1685 Cozy Corner St
- 1685 Cozy Corner St Unit n/a
- 1698 Cozy Corner St
- 1678 Ringe Ln
- 1755 Ringe Ln