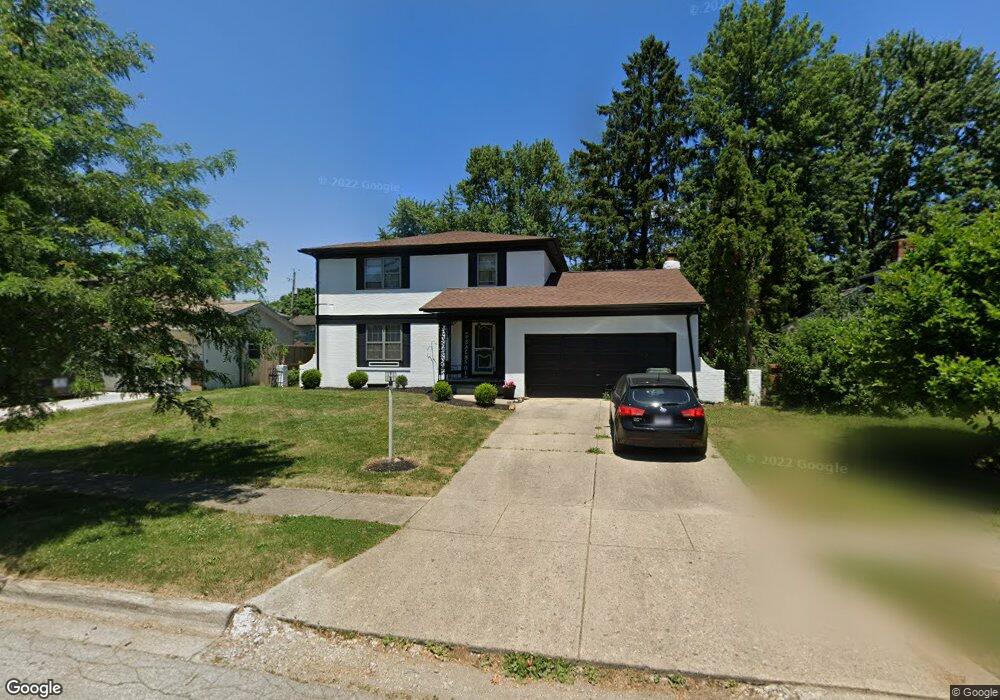
1720 Riverbirch Dr Columbus, OH 43229
Forest Park East NeighborhoodEstimated Value: $229,000 - $311,000
4
Beds
3
Baths
1,754
Sq Ft
$163/Sq Ft
Est. Value
About This Home
This home is located at 1720 Riverbirch Dr, Columbus, OH 43229 and is currently estimated at $286,624, approximately $163 per square foot. 1720 Riverbirch Dr is a home located in Franklin County with nearby schools including Parkmoor Elementary School, Woodward Park Middle School, and Northland High School.
Ownership History
Date
Name
Owned For
Owner Type
Purchase Details
Closed on
Dec 17, 2020
Sold by
Williams Nicole D
Bought by
Derden Tammy Lynette
Current Estimated Value
Home Financials for this Owner
Home Financials are based on the most recent Mortgage that was taken out on this home.
Original Mortgage
$140,409
Outstanding Balance
$125,006
Interest Rate
2.7%
Mortgage Type
FHA
Estimated Equity
$161,618
Purchase Details
Closed on
Jul 19, 2007
Sold by
Andersen Donald E and Andersen Marilyn H
Bought by
Williams Nicole D
Home Financials for this Owner
Home Financials are based on the most recent Mortgage that was taken out on this home.
Original Mortgage
$120,150
Interest Rate
6.73%
Mortgage Type
Purchase Money Mortgage
Purchase Details
Closed on
Jun 23, 1971
Bought by
Andersen Donald E
Create a Home Valuation Report for This Property
The Home Valuation Report is an in-depth analysis detailing your home's value as well as a comparison with similar homes in the area
Home Values in the Area
Average Home Value in this Area
Purchase History
| Date | Buyer | Sale Price | Title Company |
|---|---|---|---|
| Derden Tammy Lynette | $143,000 | Landsel Title Agency Inc | |
| Williams Nicole D | $133,500 | Chicago Tit | |
| Andersen Donald E | -- | -- |
Source: Public Records
Mortgage History
| Date | Status | Borrower | Loan Amount |
|---|---|---|---|
| Open | Derden Tammy Lynette | $140,409 | |
| Previous Owner | Williams Nicole D | $120,150 |
Source: Public Records
Tax History Compared to Growth
Tax History
| Year | Tax Paid | Tax Assessment Tax Assessment Total Assessment is a certain percentage of the fair market value that is determined by local assessors to be the total taxable value of land and additions on the property. | Land | Improvement |
|---|---|---|---|---|
| 2024 | $3,975 | $86,730 | $19,110 | $67,620 |
| 2023 | $3,925 | $86,730 | $19,110 | $67,620 |
| 2022 | $3,257 | $61,290 | $11,550 | $49,740 |
| 2021 | $3,263 | $61,290 | $11,550 | $49,740 |
| 2020 | $3,268 | $61,290 | $11,550 | $49,740 |
| 2019 | $2,775 | $44,630 | $8,580 | $36,050 |
| 2018 | $2,530 | $44,630 | $8,580 | $36,050 |
| 2017 | $2,645 | $44,630 | $8,580 | $36,050 |
| 2016 | $2,516 | $37,030 | $8,050 | $28,980 |
| 2015 | $2,290 | $37,030 | $8,050 | $28,980 |
| 2014 | $2,296 | $37,030 | $8,050 | $28,980 |
| 2013 | $1,192 | $38,990 | $8,470 | $30,520 |
Source: Public Records
Map
Nearby Homes
- 1704 Riverbirch Dr
- 5231 Arrowood Ct
- 5022 Sienna Ln
- 5124 Northcliff Loop W
- 1493 Boxwood Dr
- 4923 Karl Rd Unit 4925
- 1485 Norma Rd
- 2058 Northcliff Dr
- 1385 Thurell Rd
- 5204 Honeytree Loop W
- 4852 Colonel Perry Dr
- 2033 Brittany Rd
- 5056 Northtowne Blvd Unit 5054
- 5485 Tamarack Blvd
- 1722 Blue Ash Place
- 2158 Kilbourne Ave
- 4816 Bourke Rd
- 1414 Alvina Dr
- 4800 Bourke Rd
- 4849 Heatherton Dr
- 1712 Riverbirch Dr
- 1728 Riverbirch Dr
- 1721 Sugarmaple Dr
- 1736 Riverbirch Dr
- 1729 Sugarmaple Dr
- 1711 Sugarmaple Dr
- 1703 Sugarmaple Dr
- 1721 Riverbirch Dr
- 1694 Riverbirch Dr
- 1713 Riverbirch Dr
- 1744 Riverbirch Dr
- 1729 Riverbirch Dr
- 1705 Riverbirch Dr
- 1737 Riverbirch Dr
- 1695 Sugarmaple Dr
- 1745 Sugarmaple Dr
- 1695 Riverbirch Dr
- 1686 Riverbirch Dr
- 1752 Riverbirch Dr
- 1743 Riverbirch Dr