1720 S 47th St Lincoln, NE 68506
40th & A NeighborhoodEstimated Value: $246,695 - $271,000
4
Beds
4
Baths
1,423
Sq Ft
$182/Sq Ft
Est. Value
About This Home
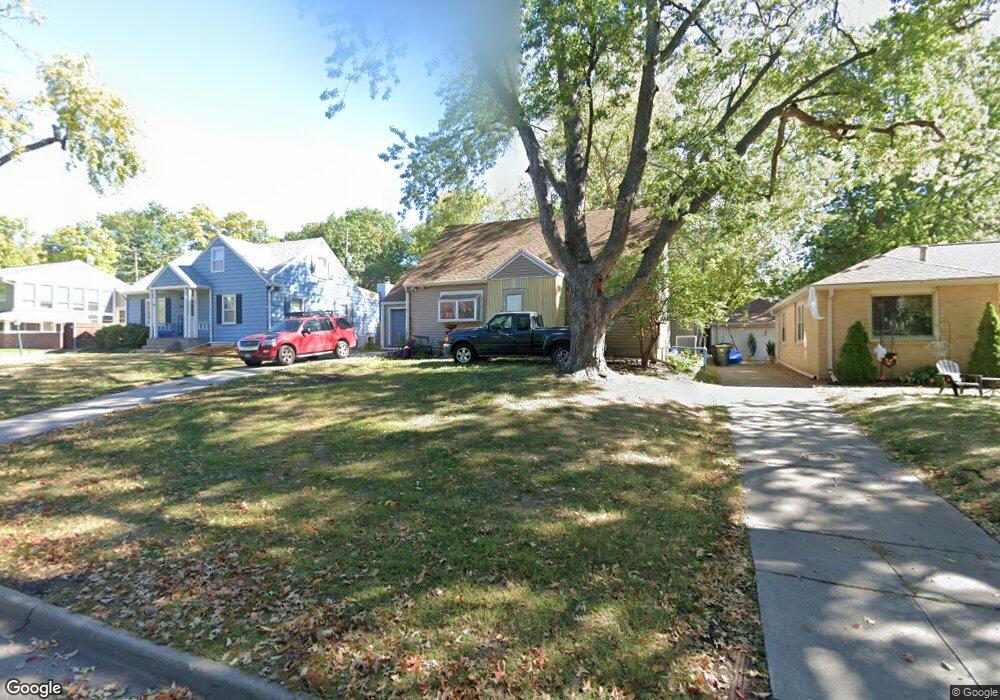
This home is located at 1720 S 47th St, Lincoln, NE 68506 and is currently estimated at $258,424, approximately $181 per square foot. 1720 S 47th St is a home located in Lancaster County with nearby schools including Holmes Elementary School, Lefler Middle School, and Lincoln Southeast High School.
Ownership History
Date
Name
Owned For
Owner Type
Purchase Details
Closed on
Aug 11, 1999
Sold by
Mook Brian P and Mook Robert
Bought by
Sherman Jerry Dale
Current Estimated Value
Home Financials for this Owner
Home Financials are based on the most recent Mortgage that was taken out on this home.
Original Mortgage
$105,300
Outstanding Balance
$29,845
Interest Rate
7.71%
Mortgage Type
FHA
Estimated Equity
$228,579
Create a Home Valuation Report for This Property
The Home Valuation Report is an in-depth analysis detailing your home's value as well as a comparison with similar homes in the area
Home Values in the Area
Average Home Value in this Area
Purchase History
| Date | Buyer | Sale Price | Title Company |
|---|---|---|---|
| Sherman Jerry Dale | $108,000 | -- |
Source: Public Records
Mortgage History
| Date | Status | Borrower | Loan Amount |
|---|---|---|---|
| Open | Sherman Jerry Dale | $105,300 |
Source: Public Records
Tax History Compared to Growth
Tax History
| Year | Tax Paid | Tax Assessment Tax Assessment Total Assessment is a certain percentage of the fair market value that is determined by local assessors to be the total taxable value of land and additions on the property. | Land | Improvement |
|---|---|---|---|---|
| 2025 | $2,923 | $239,300 | $50,000 | $189,300 |
| 2024 | $2,923 | $209,900 | $36,000 | $173,900 |
| 2023 | $3,379 | $201,600 | $36,000 | $165,600 |
| 2022 | $3,027 | $151,900 | $35,000 | $116,900 |
| 2021 | $2,864 | $151,900 | $35,000 | $116,900 |
| 2020 | $2,591 | $135,600 | $35,000 | $100,600 |
| 2019 | $2,591 | $135,600 | $35,000 | $100,600 |
| 2018 | $2,259 | $117,700 | $35,000 | $82,700 |
| 2017 | $2,280 | $117,700 | $35,000 | $82,700 |
| 2016 | $2,648 | $136,000 | $35,000 | $101,000 |
| 2015 | $2,630 | $136,000 | $35,000 | $101,000 |
| 2014 | $2,532 | $130,200 | $30,000 | $100,200 |
| 2013 | -- | $130,200 | $30,000 | $100,200 |
Source: Public Records
Map
Nearby Homes