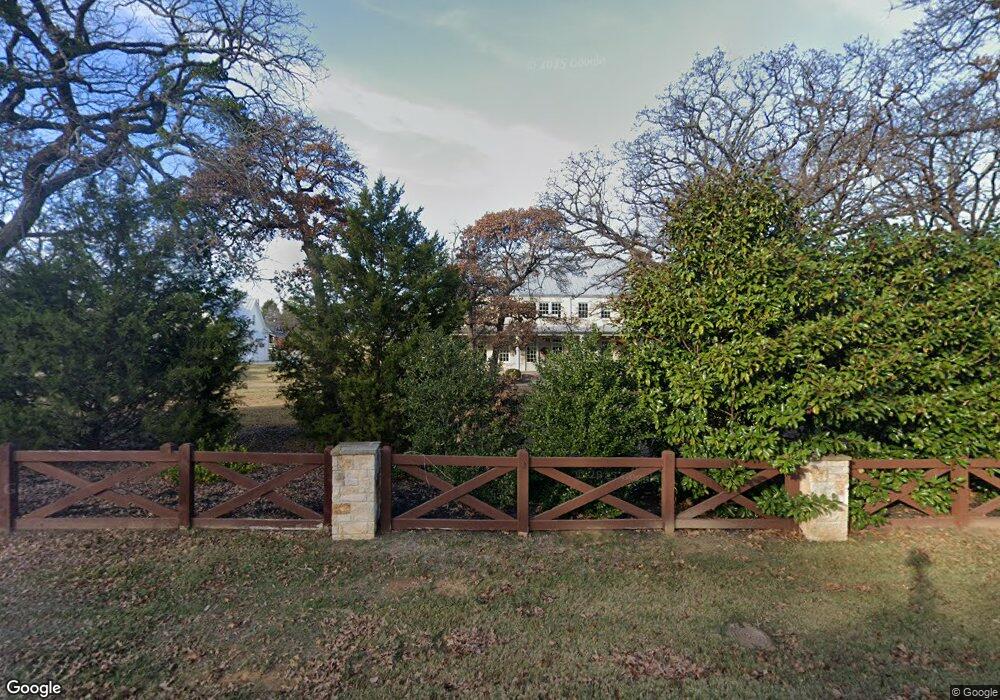
1720 Sleepy Hollow Trail Southlake, TX 76092
Estimated Value: $1,970,000 - $4,620,469
4
Beds
4
Baths
4,459
Sq Ft
$670/Sq Ft
Est. Value
About This Home
This home is located at 1720 Sleepy Hollow Trail, Southlake, TX 76092 and is currently estimated at $2,989,156, approximately $670 per square foot. 1720 Sleepy Hollow Trail is a home located in Tarrant County with nearby schools including Walnut Grove Elementary School, Don T. Durham Intermediate School, and Carroll Middle School.
Ownership History
Date
Name
Owned For
Owner Type
Purchase Details
Closed on
Oct 24, 2018
Sold by
Gregory Jodi D
Bought by
Gregory Mark S
Current Estimated Value
Purchase Details
Closed on
Oct 27, 2014
Sold by
Neidich Andre J and Neidich Rebecca S
Bought by
Gregory Mark S and Gregory Jodi D
Purchase Details
Closed on
Apr 28, 2009
Sold by
Gomez Kenneth W and Gomez Lorinda R
Bought by
Neidich Andre J and Neidich Rebecca S
Home Financials for this Owner
Home Financials are based on the most recent Mortgage that was taken out on this home.
Original Mortgage
$688,500
Interest Rate
4.84%
Mortgage Type
Purchase Money Mortgage
Purchase Details
Closed on
Nov 5, 2004
Sold by
Tompkins Lloyd G and Tompkins Diane L
Bought by
Gomez Kenneth W and Gomez Lorinda R
Home Financials for this Owner
Home Financials are based on the most recent Mortgage that was taken out on this home.
Original Mortgage
$352,000
Interest Rate
5.25%
Mortgage Type
Purchase Money Mortgage
Create a Home Valuation Report for This Property
The Home Valuation Report is an in-depth analysis detailing your home's value as well as a comparison with similar homes in the area
Home Values in the Area
Average Home Value in this Area
Purchase History
| Date | Buyer | Sale Price | Title Company |
|---|---|---|---|
| Gregory Mark S | -- | None Available | |
| Gregory Mark S | -- | None Available | |
| Neidich Andre J | -- | Hftc | |
| Gomez Kenneth W | -- | Fidelity National Title |
Source: Public Records
Mortgage History
| Date | Status | Borrower | Loan Amount |
|---|---|---|---|
| Previous Owner | Neidich Andre J | $688,500 | |
| Previous Owner | Gomez Kenneth W | $352,000 | |
| Closed | Gomez Kenneth W | $66,000 |
Source: Public Records
Tax History Compared to Growth
Tax History
| Year | Tax Paid | Tax Assessment Tax Assessment Total Assessment is a certain percentage of the fair market value that is determined by local assessors to be the total taxable value of land and additions on the property. | Land | Improvement |
|---|---|---|---|---|
| 2025 | $46,646 | $3,767,764 | $1,279,200 | $2,488,564 |
| 2024 | $46,646 | $4,651,942 | $1,279,200 | $3,372,742 |
| 2023 | $48,910 | $5,011,367 | $1,279,200 | $3,732,167 |
| 2022 | $52,629 | $2,782,052 | $1,003,500 | $1,778,552 |
| 2021 | $50,564 | $2,217,702 | $1,003,500 | $1,214,202 |
| 2020 | $48,271 | $2,100,000 | $952,800 | $1,147,200 |
| 2019 | $56,001 | $2,312,669 | $952,800 | $1,359,869 |
| 2018 | $50,037 | $2,160,391 | $952,800 | $1,207,591 |
| 2017 | $53,673 | $2,165,424 | $752,800 | $1,412,624 |
| 2016 | $31,831 | $1,284,236 | $753,300 | $530,936 |
| 2015 | $15,248 | $309,500 | $270,000 | $39,500 |
| 2014 | $15,248 | $629,100 | $270,000 | $359,100 |
Source: Public Records
Map
Nearby Homes
- 1720 Maranatha Way
- 1820 Beam Dr
- 1705 Maranatha Way
- 1711 Maranatha Way
- 1600 Enclave Ct
- 1502 Bluffview Dr
- 1425 N Peytonville Ave
- 1567 Dove Rd
- 1161 La Mirada
- 1633 Mockingbird Ln
- 1371 Holland Hill
- 1121 Post Oak Place
- 1521 Meandering Way Dr
- 1117 Post Oak Place
- 2009 Montecito Trail
- 1403 Fountain Grass Ct
- 1110 Post Oak Place
- 1609 Meandering Way Dr
- 914 Turnberry Ln
- 904 Palos Verdes Trail
- 1710 Sleepy Hollow Trail
- 1730 Sleepy Hollow Trail
- 1740 Sleepy Hollow Trail
- 1651 Morgan Rd
- 1735 Sleepy Hollow Trail
- 1725 Sleepy Hollow Trail
- 1750 Sleepy Hollow Trail
- 1629 Tuscan Ridge Cir
- 1625 Tuscan Ridge Cir
- 1633 Tuscan Ridge Cir
- 1621 Tuscan Ridge Cir
- 2003 Morgan Rd
- 1655 Morgan Rd
- 1617 Tuscan Ridge Cir
- 1613 Tuscan Ridge Cir
- 1637 Tuscan Ridge Cir
- 1770 Sleepy Hollow Trail
- 1705 Sleepy Hollow Trail
- 1641 Tuscan Ridge Cir
- 1760 Sleepy Hollow Trail