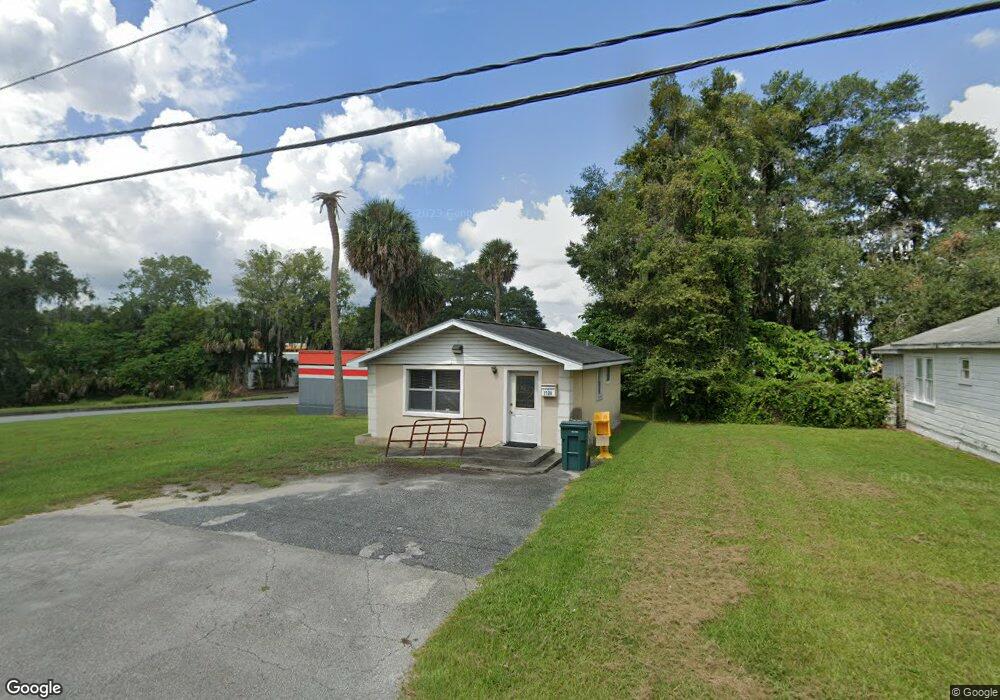
1720 SW 2nd Ave Ocala, FL 34471
Southeast Ocala NeighborhoodEstimated Value: $145,000 - $195,000
Studio
3
Baths
1,017
Sq Ft
$165/Sq Ft
Est. Value
About This Home
This home is located at 1720 SW 2nd Ave, Ocala, FL 34471 and is currently estimated at $167,812, approximately $165 per square foot. 1720 SW 2nd Ave is a home located in Marion County with nearby schools including South Ocala Elementary School, Osceola Middle School, and Forest High School.
Ownership History
Date
Name
Owned For
Owner Type
Purchase Details
Closed on
Mar 20, 2024
Sold by
Drc24 Llc
Bought by
Jm Ocala Investments Llc
Current Estimated Value
Purchase Details
Closed on
Nov 15, 2023
Sold by
Singh David
Bought by
Drc24 Llc and Jm Ocala Investments Llc
Purchase Details
Closed on
Jun 3, 2013
Sold by
Singh Doreen
Bought by
Singh David
Home Financials for this Owner
Home Financials are based on the most recent Mortgage that was taken out on this home.
Original Mortgage
$60,000
Interest Rate
8%
Mortgage Type
Balloon
Purchase Details
Closed on
Jun 8, 2010
Sold by
Singh Doreen D
Bought by
Singh Doreen and The Doreen Singh Revocable Trust
Purchase Details
Closed on
Mar 29, 2005
Sold by
Pagidipati Rudrama
Bought by
Singh Doreen D
Home Financials for this Owner
Home Financials are based on the most recent Mortgage that was taken out on this home.
Original Mortgage
$56,918
Interest Rate
5.74%
Mortgage Type
Purchase Money Mortgage
Create a Home Valuation Report for This Property
The Home Valuation Report is an in-depth analysis detailing your home's value as well as a comparison with similar homes in the area
Home Values in the Area
Average Home Value in this Area
Purchase History
| Date | Buyer | Sale Price | Title Company |
|---|---|---|---|
| Jm Ocala Investments Llc | $100 | None Listed On Document | |
| Drc24 Llc | $145,000 | None Listed On Document | |
| Singh David | $25,000 | Brick City Title Insurance A | |
| Singh Doreen | -- | Brick City | |
| Singh Doreen D | $75,000 | Brick City Title Ins Co Inc |
Source: Public Records
Mortgage History
| Date | Status | Borrower | Loan Amount |
|---|---|---|---|
| Previous Owner | Singh David | $60,000 | |
| Previous Owner | Singh Doreen D | $56,918 |
Source: Public Records
Tax History Compared to Growth
Tax History
| Year | Tax Paid | Tax Assessment Tax Assessment Total Assessment is a certain percentage of the fair market value that is determined by local assessors to be the total taxable value of land and additions on the property. | Land | Improvement |
|---|---|---|---|---|
| 2025 | $2,366 | $119,806 | $22,652 | $97,154 |
| 2024 | $2,197 | $108,218 | $22,652 | $85,566 |
| 2023 | $2,197 | $68,815 | -- | -- |
| 2022 | $1,324 | $65,354 | $0 | $0 |
| 2021 | $1,327 | $63,411 | $22,652 | $40,759 |
| 2020 | $1,158 | $63,305 | $22,652 | $40,653 |
| 2019 | $1,124 | $60,854 | $22,652 | $38,202 |
| 2018 | $1,103 | $60,692 | $19,600 | $41,092 |
| 2017 | $1,119 | $60,568 | $19,600 | $40,968 |
| 2016 | $1,130 | $60,409 | $0 | $0 |
| 2015 | $1,133 | $59,660 | $0 | $0 |
| 2014 | $1,036 | $58,613 | $0 | $0 |
Source: Public Records
Map
Nearby Homes
- 0 SW 18th Street Rd Unit MFROM709142
- 00 SE 17th St
- 0 SE 17th St
- 0 SW 16th Place
- 150 SE 17th St Unit 2 & 3
- 00 SW 15th Place
- 206 SE 18th Place
- TBD SE 4th Ave
- 15 2580 Se 1st Ave Unit 15
- 1829 SE 6th Ave
- TBD SW 9th Ave
- 2580 SE 1st Ave Unit Lot 103
- 2580 SE 1st Ave Unit 121
- 2580 SE 1st Ave Unit 15
- 2580 SE 1st Ave Unit 114
- 1714 SE 7th Ave
- 2360 SW 6th Ave
- 652 SE 18th St
- 504 SE 11th St
- 1827 SE 7th Ave
- 1710 SW 2nd Ave
- 1741 S Pine Ave
- 1730 SW 1 Ave
- 1730 SW 1st Ave
- 106 SW 17th St
- TBD SW 18th St
- 000 SW 17th St
- 1825 S Pine Ave
- 1704 S Pine Ave
- 1835 S Pine Ave
- 60 SW 17th St
- 0 SW 18th Street Rd Unit MFRA4611347
- 0 SW 18th Street Rd Unit MFROM658669
- 0 SW 18th Street Rd Unit OM504683
- 00 SW 18th Ave Rd
- 00 SW 18th St
- 0 SW 18th St
- 1643 SW 1st Ave
- 1824 S Pine Ave
- 47 SW 17th St