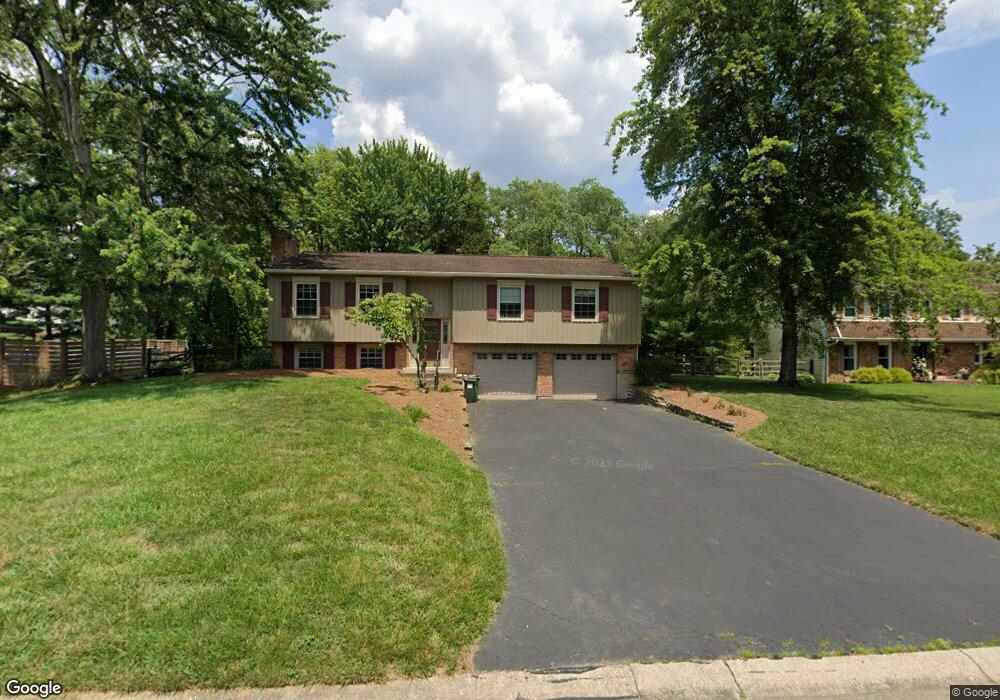
1720 Tanglewood Dr Loveland, OH 45140
Estimated Value: $419,000 - $479,000
3
Beds
3
Baths
1,982
Sq Ft
$224/Sq Ft
Est. Value
About This Home
This home is located at 1720 Tanglewood Dr, Loveland, OH 45140 and is currently estimated at $443,763, approximately $223 per square foot. 1720 Tanglewood Dr is a home located in Hamilton County with nearby schools including Loveland Intermediate School, Loveland Primary School, and Loveland Elementary School.
Ownership History
Date
Name
Owned For
Owner Type
Purchase Details
Closed on
Jul 18, 2008
Sold by
Lail James and Lail Amanda
Bought by
Condo Laura J
Current Estimated Value
Home Financials for this Owner
Home Financials are based on the most recent Mortgage that was taken out on this home.
Original Mortgage
$115,000
Outstanding Balance
$74,490
Interest Rate
6.15%
Mortgage Type
Unknown
Estimated Equity
$369,273
Purchase Details
Closed on
May 15, 2002
Sold by
Swaine Donald R and Swaine Molly S
Bought by
Lail James and Lail Amanda
Home Financials for this Owner
Home Financials are based on the most recent Mortgage that was taken out on this home.
Original Mortgage
$134,400
Interest Rate
7.16%
Purchase Details
Closed on
Sep 30, 1997
Sold by
Rieger Richard C and Rieger Mary Susan
Bought by
Swaine Donald R and Swaine Molly S
Home Financials for this Owner
Home Financials are based on the most recent Mortgage that was taken out on this home.
Original Mortgage
$108,750
Interest Rate
7.54%
Create a Home Valuation Report for This Property
The Home Valuation Report is an in-depth analysis detailing your home's value as well as a comparison with similar homes in the area
Home Values in the Area
Average Home Value in this Area
Purchase History
| Date | Buyer | Sale Price | Title Company |
|---|---|---|---|
| Condo Laura J | $185,000 | Attorney | |
| Lail James | $168,000 | Titlequest Agency Inc | |
| Swaine Donald R | $145,000 | -- |
Source: Public Records
Mortgage History
| Date | Status | Borrower | Loan Amount |
|---|---|---|---|
| Open | Condo Laura J | $115,000 | |
| Previous Owner | Lail James | $134,400 | |
| Previous Owner | Swaine Donald R | $108,750 | |
| Closed | Lail James | $25,200 |
Source: Public Records
Tax History Compared to Growth
Tax History
| Year | Tax Paid | Tax Assessment Tax Assessment Total Assessment is a certain percentage of the fair market value that is determined by local assessors to be the total taxable value of land and additions on the property. | Land | Improvement |
|---|---|---|---|---|
| 2024 | $6,242 | $117,800 | $25,466 | $92,334 |
| 2023 | $6,408 | $117,800 | $25,466 | $92,334 |
| 2022 | $5,345 | $82,387 | $20,857 | $61,530 |
| 2021 | $5,083 | $82,387 | $20,857 | $61,530 |
| 2020 | $5,149 | $82,387 | $20,857 | $61,530 |
| 2019 | $4,713 | $70,417 | $17,826 | $52,591 |
| 2018 | $4,741 | $70,417 | $17,826 | $52,591 |
| 2017 | $4,503 | $70,417 | $17,826 | $52,591 |
| 2016 | $4,532 | $67,809 | $16,555 | $51,254 |
| 2015 | $4,574 | $67,809 | $16,555 | $51,254 |
| 2014 | $4,683 | $67,809 | $16,555 | $51,254 |
| 2013 | $3,688 | $58,468 | $15,918 | $42,550 |
Source: Public Records
Map
Nearby Homes
- 124 Pheasantlake Dr
- 1864 W Loveland Ave
- 160 Lexington Dr
- 131 Lakeview Ct
- 142 Lakeview Ct
- 796 Oak Canyon Dr
- 196 Shoemaker Dr
- 882 Quailwoods Dr
- 228 Tuscarora Dr
- 247 Sinclair Ct
- 1886 Lindenhall Dr
- 736 Mohican Dr
- 1873 Heidelberg Dr
- 185 Dogwood Dr
- 167 Dogwood Dr
- 6 Ridge Cir
- 508 Navaho Dr
- 1306 W Loveland Ave
- 9330 Greenhedge Ln
- 3021 Stratford Ct
- 1714 Tanglewood Dr
- 1726 Tanglewood Dr
- 1719 Tanglewood Dr
- 1706 Tanglewood Dr
- 1713 Tanglewood Dr
- 1725 Tanglewood Dr
- 715 Quailwoods Dr
- 1705 Tanglewood Dr
- 1713 Nimrod Blvd
- 1719 Nimrod Blvd
- 1705 Nimrod Blvd
- 457 Pintail Dr
- 739 Quailwoods Dr
- 1725 Nimrod Blvd
- 427 Pintail Dr
- 445 Pintail Dr
- 463 Pintail Dr
- 709 Quailwoods Dr
- 1800 Tanglewood Dr
- 433 Pintail Dr