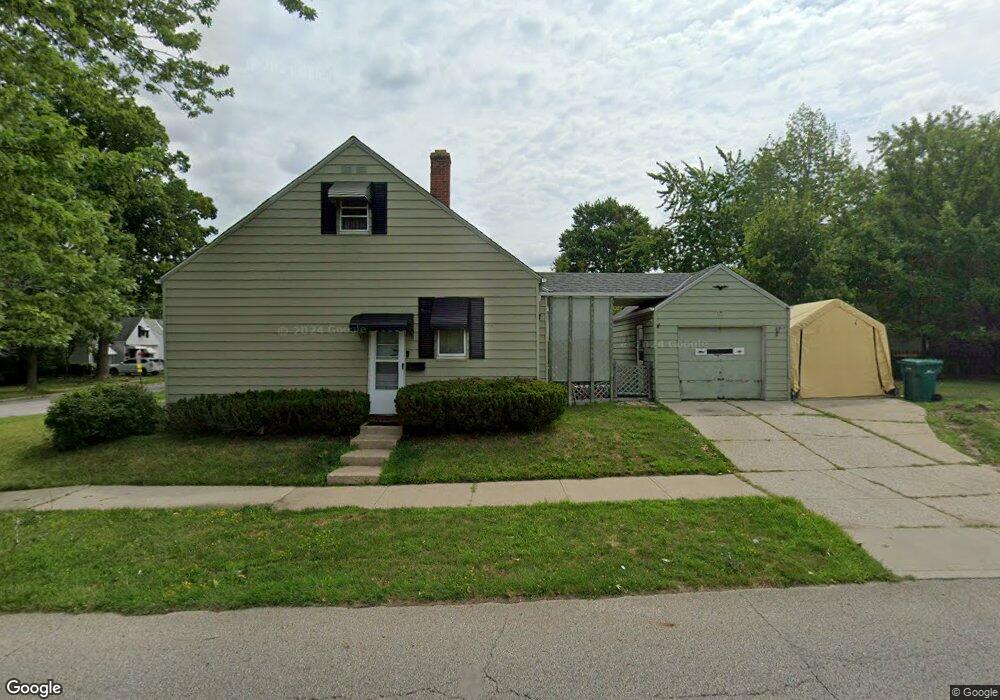
17200 Mapleboro Ave Maple Heights, OH 44137
Estimated Value: $120,777 - $138,000
3
Beds
2
Baths
1,196
Sq Ft
$107/Sq Ft
Est. Value
About This Home
This home is located at 17200 Mapleboro Ave, Maple Heights, OH 44137 and is currently estimated at $128,194, approximately $107 per square foot. 17200 Mapleboro Ave is a home located in Cuyahoga County with nearby schools including Abraham Lincoln Elementary School, Rockside/ J.F. Kennedy School, and Barack Obama School.
Ownership History
Date
Name
Owned For
Owner Type
Purchase Details
Closed on
Jul 17, 2023
Sold by
Williams Curtis L and Williams Gloria L
Bought by
Williams Family Revocable Trust and Williams
Current Estimated Value
Purchase Details
Closed on
Apr 11, 2001
Sold by
Macgillis Margaret Mary
Bought by
Williams Curtis L and Williams Gloria L
Home Financials for this Owner
Home Financials are based on the most recent Mortgage that was taken out on this home.
Original Mortgage
$78,600
Interest Rate
7.05%
Purchase Details
Closed on
Apr 6, 2001
Sold by
Estate Of John M Macgillis
Bought by
Macgillis Margaret Mary
Home Financials for this Owner
Home Financials are based on the most recent Mortgage that was taken out on this home.
Original Mortgage
$78,600
Interest Rate
7.05%
Purchase Details
Closed on
May 28, 1976
Sold by
Klich James L and Klich Karean A
Bought by
Macgillis John M
Purchase Details
Closed on
Jan 1, 1975
Bought by
Klich James L and Klich Karean A
Create a Home Valuation Report for This Property
The Home Valuation Report is an in-depth analysis detailing your home's value as well as a comparison with similar homes in the area
Home Values in the Area
Average Home Value in this Area
Purchase History
| Date | Buyer | Sale Price | Title Company |
|---|---|---|---|
| Williams Family Revocable Trust | -- | None Listed On Document | |
| Williams Curtis L | $81,000 | Executive Title Agency Corp | |
| Macgillis Margaret Mary | -- | -- | |
| Macgillis John M | $30,900 | -- | |
| Klich James L | -- | -- |
Source: Public Records
Mortgage History
| Date | Status | Borrower | Loan Amount |
|---|---|---|---|
| Previous Owner | Williams Curtis L | $78,600 |
Source: Public Records
Tax History
| Year | Tax Paid | Tax Assessment Tax Assessment Total Assessment is a certain percentage of the fair market value that is determined by local assessors to be the total taxable value of land and additions on the property. | Land | Improvement |
|---|---|---|---|---|
| 2025 | $3,129 | $38,990 | $6,370 | $32,620 |
| 2024 | $3,481 | $38,990 | $6,370 | $32,620 |
| 2023 | $2,608 | $24,820 | $4,340 | $20,480 |
| 2022 | $2,598 | $24,820 | $4,340 | $20,480 |
| 2021 | $2,772 | $24,820 | $4,340 | $20,480 |
| 2020 | $2,362 | $18,800 | $3,290 | $15,510 |
| 2019 | $2,350 | $53,700 | $9,400 | $44,300 |
| 2018 | $2,259 | $18,800 | $3,290 | $15,510 |
| 2017 | $2,349 | $18,480 | $4,270 | $14,210 |
| 2016 | $2,273 | $18,480 | $4,270 | $14,210 |
| 2015 | $2,282 | $18,480 | $4,270 | $14,210 |
| 2014 | $2,282 | $20,300 | $4,690 | $15,610 |
Source: Public Records
Map
Nearby Homes
- 17005 Mapleboro Ave
- 17409 Mapleboro Ave
- 5481 Dalewood Ave
- 5550 Grasmere Ave
- 17914 Libby Rd
- 5382 Lee Rd Unit 102
- 5666 Waterbury Ave
- 5231 Philip Ave
- 18207 Mapleboro Ave
- 5370 Lee Rd Unit 302
- 18217 Edinboro Ave
- 16406 Home St
- 5650 Lafayette Ave
- 5593 South Blvd
- 5210 Theodore St
- 5239 Arch St
- 157 Flora Dr
- 5177 Cato St
- 5716 South Blvd
- 5728 South Blvd
- 17204 Mapleboro Ave
- 17206 Mapleboro Ave
- 5461 Clement Ave
- 17210 Mapleboro Ave
- 17216 Mapleboro Ave
- 5467 Clement Ave
- 17203 Mapleboro Ave
- 17205 Mapleboro Ave
- 17220 Mapleboro Ave
- 17109 Mapleboro Ave
- 5471 Clement Ave
- 17213 Mapleboro Ave
- 17224 Mapleboro Ave
- 5422 Grasmere Ave
- 17105 Mapleboro Ave
- 17217 Mapleboro Ave
- 5426 Grasmere Ave
- 17101 Mapleboro Ave
- 5477 Clement Ave
- 17228 Mapleboro Ave
Your Personal Tour Guide
Ask me questions while you tour the home.