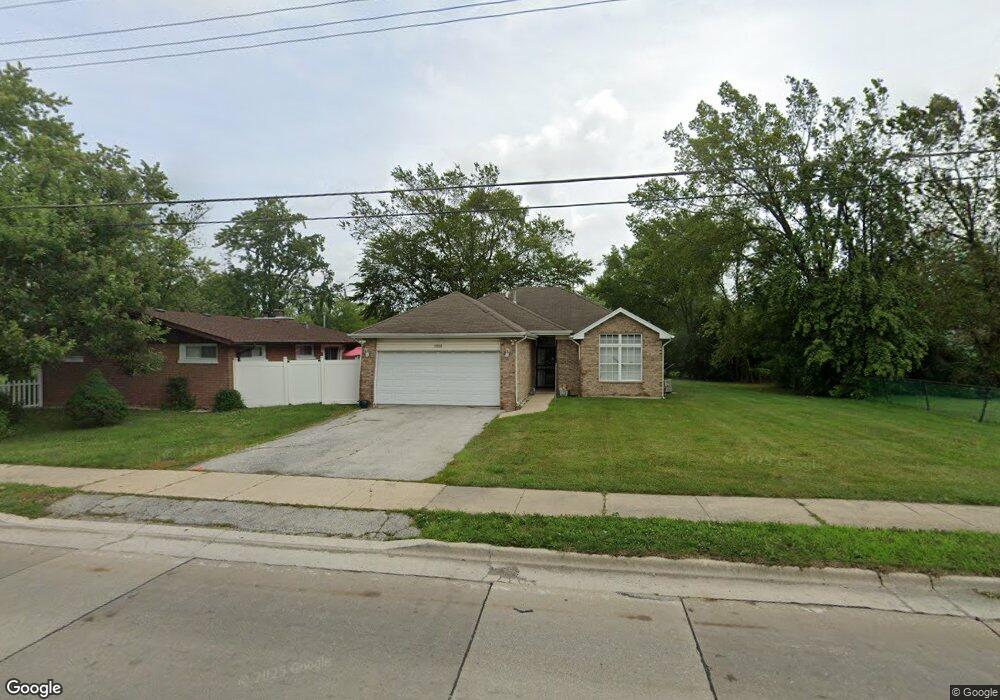
17203 Kedzie Ave Hazel Crest, IL 60429
Estimated Value: $206,086 - $263,000
3
Beds
2
Baths
1,415
Sq Ft
$159/Sq Ft
Est. Value
About This Home
This home is located at 17203 Kedzie Ave, Hazel Crest, IL 60429 and is currently estimated at $225,522, approximately $159 per square foot. 17203 Kedzie Ave is a home located in Cook County with nearby schools including Mae Jemison School, Prairie-Hills Junior High School, and Hillcrest High School.
Ownership History
Date
Name
Owned For
Owner Type
Purchase Details
Closed on
May 9, 2001
Sold by
Awai Stefan J and Awai Evette L
Bought by
Higgs La Shawn
Current Estimated Value
Home Financials for this Owner
Home Financials are based on the most recent Mortgage that was taken out on this home.
Original Mortgage
$123,405
Outstanding Balance
$53,536
Interest Rate
9.8%
Estimated Equity
$171,986
Purchase Details
Closed on
Jul 21, 1998
Sold by
Prairie Bank & Trust Company
Bought by
Awai Stefan J and Awai Evette L
Home Financials for this Owner
Home Financials are based on the most recent Mortgage that was taken out on this home.
Original Mortgage
$104,600
Interest Rate
7.07%
Purchase Details
Closed on
Oct 7, 1997
Sold by
Mcclelland James H
Bought by
Prairie Bank & Trust Company and Trust #97-075
Home Financials for this Owner
Home Financials are based on the most recent Mortgage that was taken out on this home.
Original Mortgage
$70,000
Interest Rate
8.5%
Mortgage Type
Construction
Create a Home Valuation Report for This Property
The Home Valuation Report is an in-depth analysis detailing your home's value as well as a comparison with similar homes in the area
Home Values in the Area
Average Home Value in this Area
Purchase History
| Date | Buyer | Sale Price | Title Company |
|---|---|---|---|
| Higgs La Shawn | $130,000 | First American Title | |
| Awai Stefan J | $110,600 | -- | |
| Prairie Bank & Trust Company | -- | -- |
Source: Public Records
Mortgage History
| Date | Status | Borrower | Loan Amount |
|---|---|---|---|
| Open | Higgs La Shawn | $123,405 | |
| Previous Owner | Awai Stefan J | $104,600 | |
| Previous Owner | Prairie Bank & Trust Company | $70,000 |
Source: Public Records
Tax History
| Year | Tax Paid | Tax Assessment Tax Assessment Total Assessment is a certain percentage of the fair market value that is determined by local assessors to be the total taxable value of land and additions on the property. | Land | Improvement |
|---|---|---|---|---|
| 2025 | $6,670 | $17,001 | $1,983 | $15,018 |
| 2024 | $6,670 | $17,001 | $1,983 | $15,018 |
| 2023 | $4,277 | $17,001 | $1,983 | $15,018 |
| 2022 | $4,277 | $9,931 | $1,678 | $8,253 |
| 2021 | $4,198 | $9,930 | $1,677 | $8,253 |
| 2020 | $4,170 | $9,930 | $1,677 | $8,253 |
| 2019 | $3,382 | $9,166 | $1,525 | $7,641 |
| 2018 | $3,272 | $9,166 | $1,525 | $7,641 |
| 2017 | $3,101 | $9,166 | $1,525 | $7,641 |
| 2016 | $4,089 | $10,204 | $1,372 | $8,832 |
| 2015 | $4,246 | $10,204 | $1,372 | $8,832 |
| 2014 | $3,169 | $10,204 | $1,372 | $8,832 |
| 2013 | $4,141 | $11,277 | $1,372 | $9,905 |
Source: Public Records
Map
Nearby Homes
- 3213 Woodworth Place
- 3107 173rd St
- 3100 Longfellow Ave
- 3004 Longfellow Ave
- 3012 171st St Unit GT
- 17005 Albany Ave Unit 102
- 17306 Burr Oak Ln
- 2904 Woodworth Place
- 3312 Maple Ln
- 17006 Novak Dr Unit T107
- 3107 Longfellow Ave
- 3311 Hickory Ln
- 17417 Kedzie Ave
- 17410 Emerson Ave
- 3321 173rd St
- 17113 Elm Dr
- 17405 Longfellow Ave
- 3318 Tulip Dr
- 17120 Whittier Ave
- 3214 Birchwood Dr
- 3129 172nd St
- 3132 Woodworth Place
- 3130 Woodworth Place
- 3127 172nd St
- 3126 Woodworth Place
- 3125 172nd St
- 17119 Linden Dr
- 17121 Linden Dr
- 3123 172nd St
- 3122 Woodworth Place
- 17123 Linden Dr
- 3129 Woodworth Place
- 3121 172nd St
- 3121 172nd St Unit 1
- 17115 Linden Dr
- 3120 Woodworth Place
- 3201 Woodworth Place
- 17209 Kedzie Ave
- 3125 Woodworth Place
- 17113 Linden Dr
Your Personal Tour Guide
Ask me questions while you tour the home.