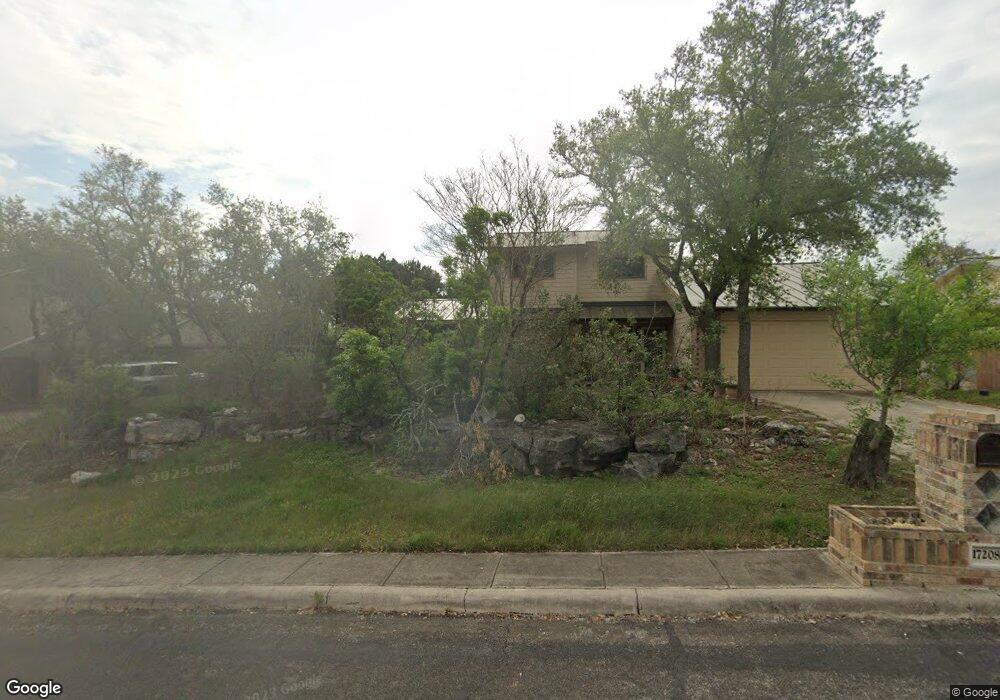
17208 Laurel Crossing Helotes, TX 78023
Estimated Value: $324,798 - $394,000
4
Beds
3
Baths
1,944
Sq Ft
$188/Sq Ft
Est. Value
About This Home
This home is located at 17208 Laurel Crossing, Helotes, TX 78023 and is currently estimated at $365,200, approximately $187 per square foot. 17208 Laurel Crossing is a home located in Bexar County with nearby schools including Los Reyes Elementary School, Garcia Middle School, and O'Connor High School.
Ownership History
Date
Name
Owned For
Owner Type
Purchase Details
Closed on
Mar 31, 2014
Sold by
The Secretary Of Veterans Affairs
Bought by
Lopez Lora S
Current Estimated Value
Purchase Details
Closed on
Oct 10, 2013
Sold by
Hollis Timothy C and Hollis Belle Marie
Bought by
Citimortgage Inc
Purchase Details
Closed on
Oct 1, 2013
Sold by
Citimortgage Inc
Bought by
Secretary Of Veterans Affairs
Purchase Details
Closed on
Jun 21, 2010
Sold by
Frazier Patricia May and Meriwether Lewis
Bought by
Hollis Timothy C
Home Financials for this Owner
Home Financials are based on the most recent Mortgage that was taken out on this home.
Original Mortgage
$139,434
Interest Rate
4.87%
Mortgage Type
VA
Purchase Details
Closed on
Sep 27, 2006
Sold by
Frazier Meriwether Lewis and Frazier Patricia May
Bought by
Frazier Meriwether Lewis and Frazier Patricia May
Create a Home Valuation Report for This Property
The Home Valuation Report is an in-depth analysis detailing your home's value as well as a comparison with similar homes in the area
Home Values in the Area
Average Home Value in this Area
Purchase History
| Date | Buyer | Sale Price | Title Company |
|---|---|---|---|
| Lopez Lora S | -- | Ttt | |
| Citimortgage Inc | $149,821 | None Available | |
| Secretary Of Veterans Affairs | -- | None Available | |
| Hollis Timothy C | -- | Alamo Title Company | |
| Frazier Meriwether Lewis | -- | None Available |
Source: Public Records
Mortgage History
| Date | Status | Borrower | Loan Amount |
|---|---|---|---|
| Previous Owner | Hollis Timothy C | $139,434 |
Source: Public Records
Tax History
| Year | Tax Paid | Tax Assessment Tax Assessment Total Assessment is a certain percentage of the fair market value that is determined by local assessors to be the total taxable value of land and additions on the property. | Land | Improvement |
|---|---|---|---|---|
| 2025 | $1,974 | $279,110 | $54,640 | $224,470 |
| 2024 | $1,974 | $283,011 | $50,120 | $266,790 |
| 2023 | $1,974 | $257,283 | $50,120 | $263,110 |
| 2022 | $5,838 | $233,894 | $26,110 | $287,210 |
| 2021 | $5,593 | $212,631 | $24,720 | $202,490 |
| 2020 | $5,295 | $193,301 | $29,030 | $195,140 |
| 2019 | $4,951 | $175,728 | $29,030 | $148,760 |
| 2018 | $4,569 | $159,753 | $29,030 | $144,210 |
| 2017 | $4,156 | $145,230 | $29,030 | $116,200 |
| 2016 | $4,590 | $160,420 | $29,030 | $131,390 |
| 2015 | $4,588 | $156,800 | $29,030 | $127,770 |
| 2014 | $4,588 | $156,680 | $0 | $0 |
Source: Public Records
Map
Nearby Homes
- 11266 Condor Pass
- 11304 Condor Pass
- 11234 Condor Pass
- 16827 Marlhead
- 16811 Coyote Ridge
- 16744 Windjammer
- 11418 Lago Vista
- 11229 Cave Creek
- 11232 Cave Creek
- 11235 Indian Caves
- 16502 Loma Landing
- 11312 Red Oak Turn
- 11224 Hill Top Bend
- 11142 Lago Vista
- 11330 Hill Top Bend
- 11331 Massive Mount
- 17132 Bandera Rd
- 10515 Cima Vista
- 15766 La Subida Trail
- 17050 Sunridge Point
- 17204 Laurel Crossing
- 17212 Laurel Crossing
- 17115 Terra Rosa
- 17119 Terra Rosa
- 11316 Mountain Climb
- 17202 Laurel Crossing
- 17111 Terra Rosa
- 11253 Condor Pass
- 17322 Commanche Bluff
- 11302 Mountain Climb
- 17330 Comanche Bluff
- 17330 Commanche Bluff
- 17318 Commanche Bluff
- 11230 Condor Pass
- 11218 Condor Pass
- 11261 Condor Pass
- 11249 Condor Pass
- 11257 Condor Pass
- 11210 Condor Pass
- 11245 Condor Pass
Your Personal Tour Guide
Ask me questions while you tour the home.