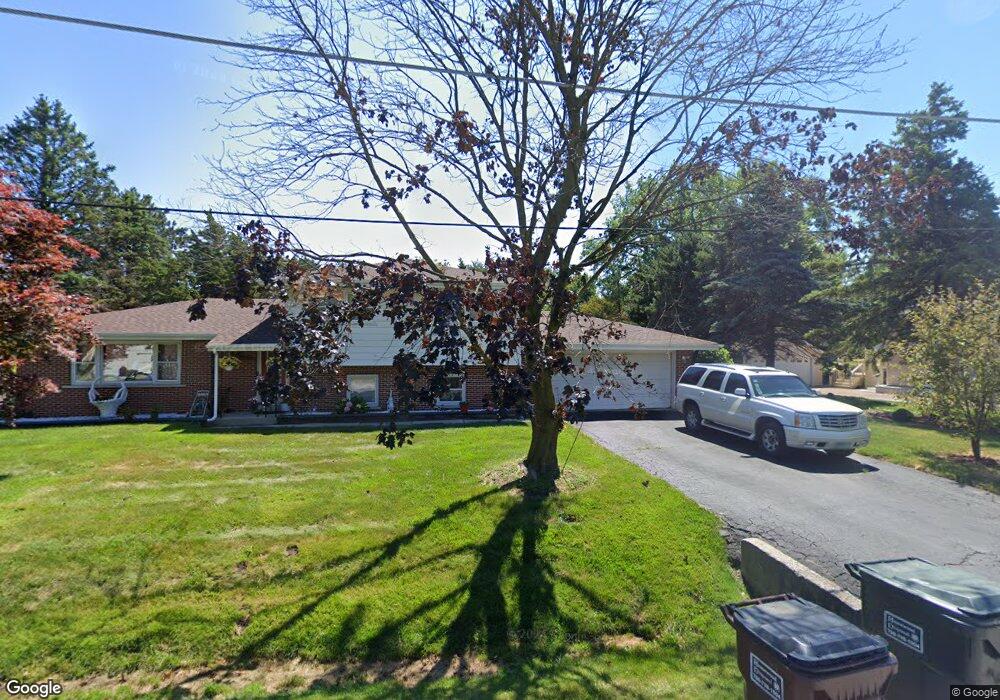
17209 Fisk St Hazel Crest, IL 60429
Estimated Value: $199,000 - $278,000
3
Beds
2
Baths
1,336
Sq Ft
$178/Sq Ft
Est. Value
About This Home
This home is located at 17209 Fisk St, Hazel Crest, IL 60429 and is currently estimated at $238,403, approximately $178 per square foot. 17209 Fisk St is a home located in Cook County with nearby schools including Thornwood High School.
Ownership History
Date
Name
Owned For
Owner Type
Purchase Details
Closed on
Mar 28, 2013
Sold by
Vallow Mary
Bought by
Zambrano Ismael
Current Estimated Value
Home Financials for this Owner
Home Financials are based on the most recent Mortgage that was taken out on this home.
Original Mortgage
$68,197
Outstanding Balance
$47,655
Interest Rate
3.25%
Mortgage Type
FHA
Estimated Equity
$190,748
Create a Home Valuation Report for This Property
The Home Valuation Report is an in-depth analysis detailing your home's value as well as a comparison with similar homes in the area
Home Values in the Area
Average Home Value in this Area
Purchase History
| Date | Buyer | Sale Price | Title Company |
|---|---|---|---|
| Zambrano Ismael | $85,000 | Chicago Title Insurance Comp |
Source: Public Records
Mortgage History
| Date | Status | Borrower | Loan Amount |
|---|---|---|---|
| Open | Zambrano Ismael | $68,197 |
Source: Public Records
Tax History Compared to Growth
Tax History
| Year | Tax Paid | Tax Assessment Tax Assessment Total Assessment is a certain percentage of the fair market value that is determined by local assessors to be the total taxable value of land and additions on the property. | Land | Improvement |
|---|---|---|---|---|
| 2024 | $8,671 | $20,001 | $3,945 | $16,056 |
| 2023 | $5,968 | $20,001 | $3,945 | $16,056 |
| 2022 | $5,968 | $12,591 | $3,506 | $9,085 |
| 2021 | $5,916 | $12,591 | $3,506 | $9,085 |
| 2020 | $6,374 | $13,506 | $3,506 | $10,000 |
| 2019 | $4,564 | $11,062 | $3,067 | $7,995 |
| 2018 | $4,511 | $11,062 | $3,067 | $7,995 |
| 2017 | $4,569 | $11,062 | $3,067 | $7,995 |
| 2016 | $4,819 | $11,086 | $2,629 | $8,457 |
| 2015 | $4,592 | $11,086 | $2,629 | $8,457 |
| 2014 | $4,534 | $11,086 | $2,629 | $8,457 |
| 2013 | $4,928 | $12,661 | $2,629 | $10,032 |
Source: Public Records
Map
Nearby Homes
- 1001 172nd St
- 1100 173rd St
- 17304 Lathrop Ave
- 1025 171st St
- 1113 171st St
- 1321 172nd St
- 17406 Throop St
- 1314 174th St
- 1409 172nd St
- 1411 172nd St
- 17231 Laflin Ave
- 1514 173rd St
- 16604 Finch Ave
- 16610 Geneva Dr
- 16632 Emerald Ave
- 16626 Union Ave
- 1710 169th St
- 16259 Center St
- 16929 Wood St
- 16919 Wood St