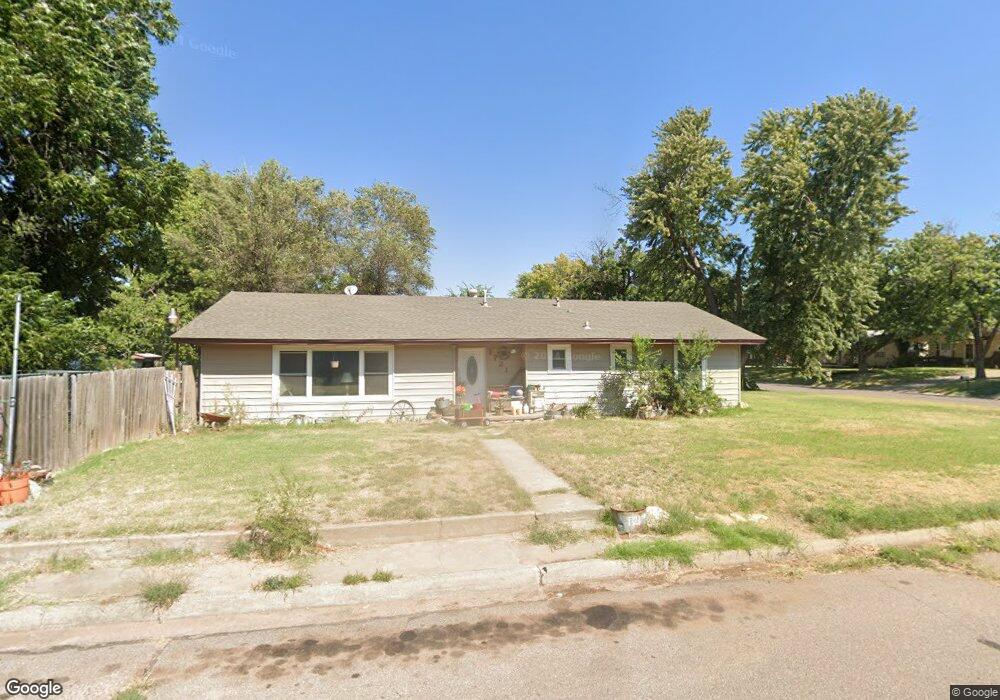
1721 20th St Woodward, OK 73801
Estimated Value: $136,197 - $161,000
3
Beds
2
Baths
1,874
Sq Ft
$78/Sq Ft
Est. Value
About This Home
This home is located at 1721 20th St, Woodward, OK 73801 and is currently estimated at $146,049, approximately $77 per square foot. 1721 20th St is a home located in Woodward County with nearby schools including Woodward High School and Woodward Christian Academy.
Ownership History
Date
Name
Owned For
Owner Type
Purchase Details
Closed on
Nov 26, 2013
Bought by
Patrick April A
Current Estimated Value
Purchase Details
Closed on
Sep 25, 2012
Sold by
Jantz Kevin M and Jantz Jami L
Bought by
Patrick Caleb M
Home Financials for this Owner
Home Financials are based on the most recent Mortgage that was taken out on this home.
Original Mortgage
$65,000
Interest Rate
3.66%
Mortgage Type
Unknown
Purchase Details
Closed on
Apr 8, 2005
Sold by
Richardson Roy Carl
Bought by
Richardson Anna Bell
Create a Home Valuation Report for This Property
The Home Valuation Report is an in-depth analysis detailing your home's value as well as a comparison with similar homes in the area
Home Values in the Area
Average Home Value in this Area
Purchase History
| Date | Buyer | Sale Price | Title Company |
|---|---|---|---|
| Patrick April A | -- | -- | |
| Patrick Caleb M | $104,000 | None Available | |
| Richardson Anna Bell | -- | -- |
Source: Public Records
Mortgage History
| Date | Status | Borrower | Loan Amount |
|---|---|---|---|
| Previous Owner | Patrick Caleb M | $65,000 |
Source: Public Records
Tax History Compared to Growth
Tax History
| Year | Tax Paid | Tax Assessment Tax Assessment Total Assessment is a certain percentage of the fair market value that is determined by local assessors to be the total taxable value of land and additions on the property. | Land | Improvement |
|---|---|---|---|---|
| 2023 | $859 | $9,416 | $1,173 | $8,243 |
| 2022 | $845 | $9,097 | $1,173 | $7,924 |
| 2021 | $1,040 | $11,507 | $1,173 | $10,334 |
| 2020 | $1,048 | $11,507 | $1,173 | $10,334 |
| 2019 | $1,054 | $11,805 | $1,173 | $10,632 |
| 2018 | $1,020 | $11,243 | $1,173 | $10,070 |
| 2017 | $961 | $10,708 | $1,173 | $9,535 |
| 2016 | $1,041 | $11,440 | $792 | $10,648 |
| 2015 | $1,000 | $11,440 | $792 | $10,648 |
| 2014 | $1,000 | $11,440 | $792 | $10,648 |
Source: Public Records
Map
Nearby Homes