Estimated Value: $168,000 - $186,149
4
Beds
2
Baths
1,373
Sq Ft
$131/Sq Ft
Est. Value
About This Home
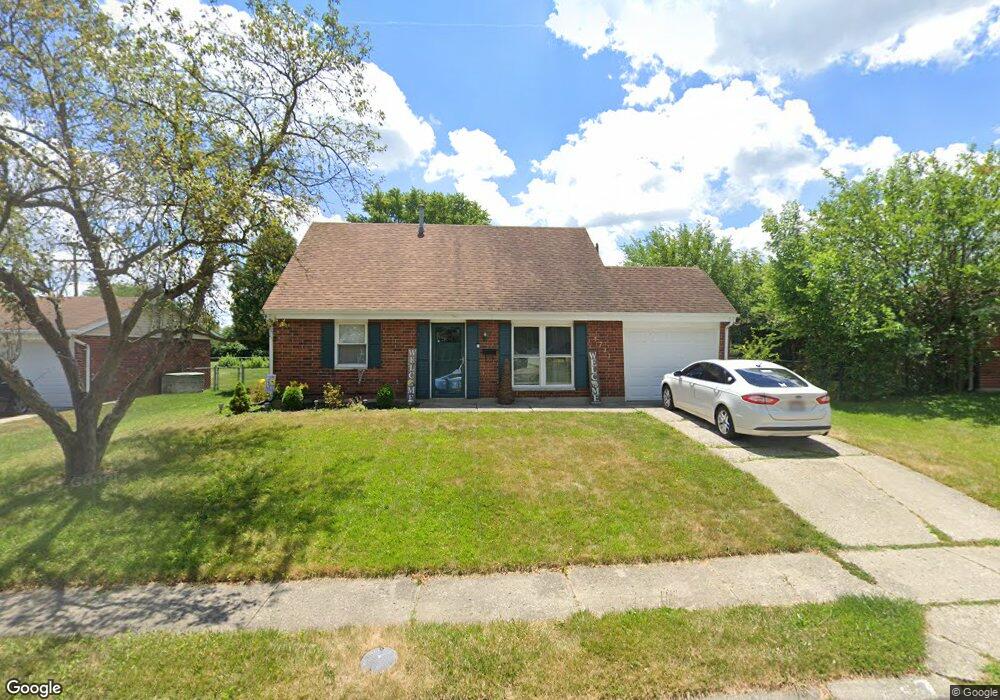
This home is located at 1721 Amherst St, Piqua, OH 45356 and is currently estimated at $179,787, approximately $130 per square foot. 1721 Amherst St is a home located in Miami County with nearby schools including Washington Primary School, Piqua Junior High School, and Piqua High School.
Ownership History
Date
Name
Owned For
Owner Type
Purchase Details
Closed on
Aug 20, 2021
Sold by
Klosterman C Richard C and Klosterman Denise
Bought by
Powers Skyler W
Current Estimated Value
Home Financials for this Owner
Home Financials are based on the most recent Mortgage that was taken out on this home.
Original Mortgage
$131,100
Outstanding Balance
$119,031
Interest Rate
2.8%
Mortgage Type
New Conventional
Estimated Equity
$60,756
Purchase Details
Closed on
Jul 31, 2012
Sold by
Deutsche Bank National Truts Company
Bought by
Klosterman C Richard and Klosterman Denise
Purchase Details
Closed on
May 15, 2012
Sold by
Wion Carolyn S
Bought by
Deutsche Bank National Trust Company
Purchase Details
Closed on
Nov 12, 2002
Sold by
Wion William Todd
Bought by
Wion Carolyn S
Purchase Details
Closed on
Mar 18, 1996
Sold by
Stump Mathew A
Bought by
Wion William T and Wion Carolyn S
Purchase Details
Closed on
Sep 1, 1993
Bought by
Stump Matthew A
Create a Home Valuation Report for This Property
The Home Valuation Report is an in-depth analysis detailing your home's value as well as a comparison with similar homes in the area
Home Values in the Area
Average Home Value in this Area
Purchase History
| Date | Buyer | Sale Price | Title Company |
|---|---|---|---|
| Powers Skyler W | $138,000 | None Available | |
| Klosterman C Richard | $35,250 | Attorney | |
| Deutsche Bank National Trust Company | $48,000 | None Available | |
| Wion Carolyn S | -- | -- | |
| Wion William T | $73,000 | -- | |
| Stump Matthew A | $67,000 | -- |
Source: Public Records
Mortgage History
| Date | Status | Borrower | Loan Amount |
|---|---|---|---|
| Open | Powers Skyler W | $131,100 |
Source: Public Records
Tax History Compared to Growth
Tax History
| Year | Tax Paid | Tax Assessment Tax Assessment Total Assessment is a certain percentage of the fair market value that is determined by local assessors to be the total taxable value of land and additions on the property. | Land | Improvement |
|---|---|---|---|---|
| 2024 | $1,805 | $43,930 | $8,400 | $35,530 |
| 2023 | $1,805 | $43,930 | $8,400 | $35,530 |
| 2022 | $1,837 | $43,930 | $8,400 | $35,530 |
| 2021 | $1,522 | $32,550 | $6,230 | $26,320 |
| 2020 | $1,496 | $32,550 | $6,230 | $26,320 |
| 2019 | $1,504 | $32,550 | $6,230 | $26,320 |
| 2018 | $1,404 | $28,950 | $6,230 | $22,720 |
| 2017 | $1,421 | $28,950 | $6,230 | $22,720 |
| 2016 | $1,406 | $28,950 | $6,230 | $22,720 |
| 2015 | $1,439 | $28,950 | $6,230 | $22,720 |
| 2014 | $1,439 | $28,950 | $6,230 | $22,720 |
| 2013 | $1,444 | $28,950 | $6,230 | $22,720 |
Source: Public Records
Map
Nearby Homes
- 1706 Williams Place
- 1725 Dover Ave
- 1715 Dover Ave
- 918 Falmouth Ave
- 920 New Haven Rd
- 809 Candlewood Blvd
- 806 Candlewood Blvd
- 1505 Amherst Ave
- 1513 Arrowhead Dr
- 1502 Arrowhead Dr
- Ironwood Plan at Arrowhead Estates
- Juniper Plan at Arrowhead Estates
- Spruce Plan at Arrowhead Estates
- Aspen II Plan at Arrowhead Estates
- Norway Plan at Arrowhead Estates
- Palmetto Plan at Arrowhead Estates
- Walnut Plan at Arrowhead Estates
- Ashton Plan at Arrowhead Estates
- Empress Plan at Arrowhead Estates
- Chestnut Plan at Arrowhead Estates
- 1721 Amherst Ave
- 1719 Amherst St
- 1001 Concord Ave
- 1003 Concord Ave
- 1717 Amherst St
- 1720 Amherst Ave
- 1718 Amherst Ave
- 1720 Amherst St
- 1005 Concord Ave
- 1722 Amherst St
- 1718 Amherst St
- 1715 Amherst St
- 1000 Concord Ave
- 1632 Haverhill Dr
- 1724 Amherst St
- 1716 Amherst St
- 1007 Concord Ave
- 1002 Concord Ave
- 1628 Haverhill Dr
- 1630 Haverhill Dr