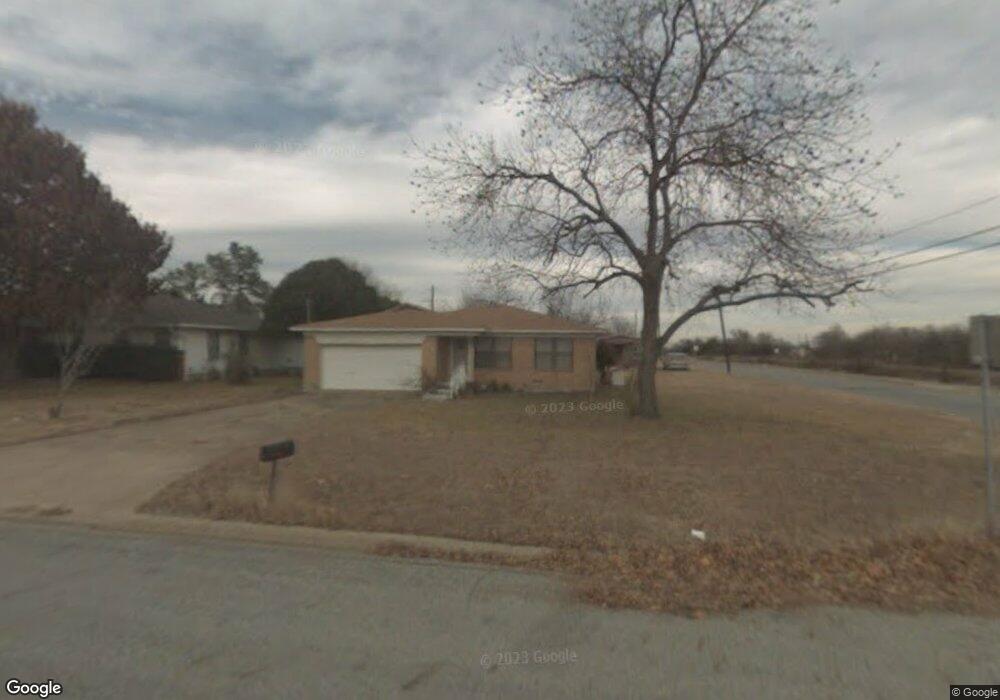
1721 E Mildred St Sherman, TX 75090
Estimated Value: $185,323 - $208,000
3
Beds
2
Baths
1,080
Sq Ft
$182/Sq Ft
Est. Value
About This Home
This home is located at 1721 E Mildred St, Sherman, TX 75090 and is currently estimated at $196,662, approximately $182 per square foot. 1721 E Mildred St is a home located in Grayson County with nearby schools including Percy W. Neblett Elementary School, Dillingham Intermediate School, and Piner Middle School.
Ownership History
Date
Name
Owned For
Owner Type
Purchase Details
Closed on
Sep 15, 2020
Sold by
Phan Jessica Thuy
Bought by
Dang Dung T
Current Estimated Value
Purchase Details
Closed on
Sep 5, 2020
Sold by
Dang Dung T
Bought by
Harp Jan
Purchase Details
Closed on
Aug 5, 2013
Sold by
Hedgpeth Calmore Nichols
Bought by
Dang Dung T
Home Financials for this Owner
Home Financials are based on the most recent Mortgage that was taken out on this home.
Original Mortgage
$58,000
Interest Rate
4.49%
Mortgage Type
New Conventional
Purchase Details
Closed on
Jul 30, 2013
Sold by
Hedgpeth Patricia A
Bought by
Hedgpeth Calmore Nichols
Home Financials for this Owner
Home Financials are based on the most recent Mortgage that was taken out on this home.
Original Mortgage
$58,000
Interest Rate
4.49%
Mortgage Type
New Conventional
Create a Home Valuation Report for This Property
The Home Valuation Report is an in-depth analysis detailing your home's value as well as a comparison with similar homes in the area
Home Values in the Area
Average Home Value in this Area
Purchase History
| Date | Buyer | Sale Price | Title Company |
|---|---|---|---|
| Dang Dung T | -- | None Available | |
| Harp Jan | -- | None Available | |
| Dang Dung T | -- | None Available | |
| Hedgpeth Calmore Nichols | -- | None Available |
Source: Public Records
Mortgage History
| Date | Status | Borrower | Loan Amount |
|---|---|---|---|
| Previous Owner | Dang Dung T | $58,000 |
Source: Public Records
Tax History Compared to Growth
Tax History
| Year | Tax Paid | Tax Assessment Tax Assessment Total Assessment is a certain percentage of the fair market value that is determined by local assessors to be the total taxable value of land and additions on the property. | Land | Improvement |
|---|---|---|---|---|
| 2025 | $4,358 | $191,534 | $56,560 | $134,974 |
| 2024 | $4,358 | $198,707 | $56,560 | $142,147 |
| 2023 | $3,933 | $179,114 | $40,320 | $138,794 |
| 2022 | $3,635 | $155,101 | $17,640 | $137,461 |
| 2021 | $3,110 | $124,063 | $17,640 | $106,423 |
| 2020 | $1,969 | $75,014 | $17,640 | $57,374 |
| 2019 | $1,804 | $66,941 | $7,700 | $59,241 |
| 2018 | $1,600 | $63,768 | $7,700 | $56,068 |
| 2017 | $1,474 | $59,199 | $7,700 | $51,499 |
| 2016 | $1,119 | $44,943 | $7,700 | $37,243 |
| 2015 | $1,159 | $46,648 | $7,700 | $38,948 |
| 2014 | $879 | $35,380 | $7,700 | $27,680 |
Source: Public Records
Map
Nearby Homes
- 1705 E Hilton St
- 1516 E Peyton St
- 1915 E Cole Ave
- 1721 N Hoard Ave
- 1511 N Brents Ave
- 13 E Lewis St
- 1 E Lewis St
- 5 E Lewis St
- 14 E Lewis St
- 1416 N Cleveland Ave
- 2012 Texoma Pkwy
- 15.125 acres E Peyton St
- 1215 N Grand Ave
- 914 Boone Dr
- 1110 N Ross Ave
- 2700 E Us-82
- 2233 E Tuck St
- 2606 Bennett Ave
- 1007 N Cleveland Ave
- 2239 E Tuck St
- 1717 E Mildred St
- 2118 N Frisco Rd
- 1713 E Mildred St
- 1722 E Mildred St
- 1718 E Mildred St
- 1714 E Peyton St
- 1709 E Mildred St
- 1718 E Peyton St
- 1714 E Mildred St
- 1725 E Hilton St
- 1729 E Hilton St
- 1705 E Mildred St
- 1710 E Mildred St
- 1706 E Peyton St
- 1717 E Hilton St
- 1713 E Hilton St
- 1702 E Peyton St
- 1706 E Mildred St
- 1709 E Hilton St
- 1701 E Mildred St