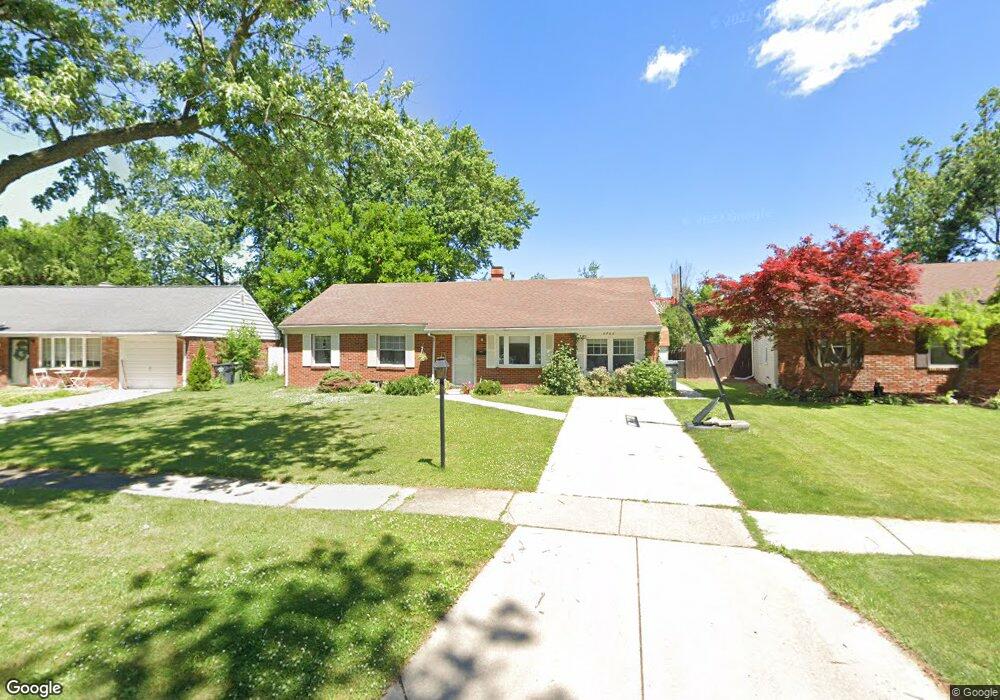
1721 Parkway Dr N Maumee, OH 43537
Estimated Value: $188,000 - $206,000
3
Beds
1
Bath
962
Sq Ft
$204/Sq Ft
Est. Value
About This Home
This home is located at 1721 Parkway Dr N, Maumee, OH 43537 and is currently estimated at $196,291, approximately $204 per square foot. 1721 Parkway Dr N is a home located in Lucas County with nearby schools including Maumee Intermediate School, Fort Miami Elementary School, and Maumee Middle School.
Ownership History
Date
Name
Owned For
Owner Type
Purchase Details
Closed on
Apr 30, 2008
Sold by
Risner Manda and Risner Bryan
Bought by
Arend Cathy A
Current Estimated Value
Home Financials for this Owner
Home Financials are based on the most recent Mortgage that was taken out on this home.
Original Mortgage
$109,250
Outstanding Balance
$69,368
Interest Rate
5.93%
Mortgage Type
Purchase Money Mortgage
Estimated Equity
$126,923
Purchase Details
Closed on
Aug 6, 2004
Sold by
Batdorf Gary F and Batdorf Valerie
Bought by
Ostendorf Manda
Home Financials for this Owner
Home Financials are based on the most recent Mortgage that was taken out on this home.
Original Mortgage
$86,400
Interest Rate
6.34%
Mortgage Type
Purchase Money Mortgage
Purchase Details
Closed on
Nov 12, 1992
Sold by
Cerden Florence M
Create a Home Valuation Report for This Property
The Home Valuation Report is an in-depth analysis detailing your home's value as well as a comparison with similar homes in the area
Home Values in the Area
Average Home Value in this Area
Purchase History
| Date | Buyer | Sale Price | Title Company |
|---|---|---|---|
| Arend Cathy A | $115,000 | Chicago Title Insurance Co | |
| Ostendorf Manda | $108,000 | Port Lawrence | |
| -- | $70,000 | -- |
Source: Public Records
Mortgage History
| Date | Status | Borrower | Loan Amount |
|---|---|---|---|
| Open | Arend Cathy A | $109,250 | |
| Previous Owner | Ostendorf Manda | $86,400 |
Source: Public Records
Tax History Compared to Growth
Tax History
| Year | Tax Paid | Tax Assessment Tax Assessment Total Assessment is a certain percentage of the fair market value that is determined by local assessors to be the total taxable value of land and additions on the property. | Land | Improvement |
|---|---|---|---|---|
| 2024 | $1,861 | $57,575 | $15,295 | $42,280 |
| 2023 | $3,418 | $45,115 | $12,810 | $32,305 |
| 2022 | $3,039 | $45,115 | $12,810 | $32,305 |
| 2021 | $3,209 | $45,115 | $12,810 | $32,305 |
| 2020 | $3,011 | $37,730 | $10,500 | $27,230 |
| 2019 | $2,936 | $37,730 | $10,500 | $27,230 |
| 2018 | $2,966 | $37,730 | $10,500 | $27,230 |
| 2017 | $3,036 | $36,120 | $10,955 | $25,165 |
| 2016 | $3,012 | $103,200 | $31,300 | $71,900 |
| 2015 | $3,006 | $103,200 | $31,300 | $71,900 |
| 2014 | $2,596 | $35,430 | $10,750 | $24,680 |
| 2013 | $2,596 | $35,430 | $10,750 | $24,680 |
Source: Public Records
Map
Nearby Homes
- 4237 Brogan Dr
- 1466 Wilderness Dr
- 4035 Greencrest Ln
- 5125 Stengel Ave
- 1220 Birch Ave
- 5022 Stengel Ave
- 1181 Craig Rd
- 632 Brahier Ln
- 3044 Villa Dr
- 1206 Fort St
- 1057 Keeler St
- 649 Midfield Dr
- 4522 Heathercove Place
- 1553 Heather Meadow Dr
- 504 Fairfield Park Dr
- 1978 Sunnylawn Dr
- 855 Lamonde Dr
- 2017 Green Valley Dr
- 4784 Santa Maria Dr
- 812 Loch Haven Blvd
- 1717 Parkway Dr N
- 1725 Parkway Dr N
- 1713 Parkway Dr N
- 1729 Parkway Dr N
- 1709 N Pkwy
- 1709 Parkway Dr N
- 1720 Parkway Dr N
- 1712 Parkway Dr N
- 1728 Parkway Dr N
- 1624 Michigan Ave
- 1705 Parkway Dr N
- 1737 Parkway Dr N
- 1732 Parkway Dr N
- 1704 Parkway Dr N
- 1741 Parkway Dr N
- 1612 Michigan Ave
- 1620 Michigan Ave
- 1709 Parkway Dr S
- 1713 Parkway Dr S
- 1740 Parkway Dr N