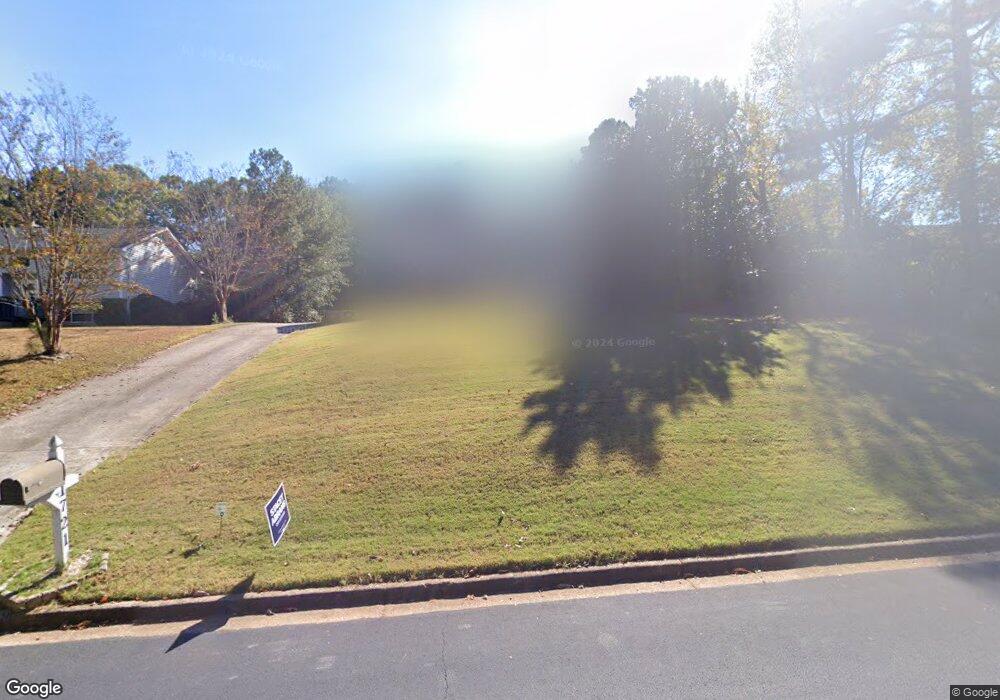
1721 Rolling Hills Trail SE Conyers, GA 30094
Estimated Value: $284,000 - $315,348
4
Beds
3
Baths
1,602
Sq Ft
$188/Sq Ft
Est. Value
About This Home
This home is located at 1721 Rolling Hills Trail SE, Conyers, GA 30094 and is currently estimated at $300,587, approximately $187 per square foot. 1721 Rolling Hills Trail SE is a home located in Rockdale County with nearby schools including Sims Elementary School, Edwards Middle School, and Heritage High School.
Ownership History
Date
Name
Owned For
Owner Type
Purchase Details
Closed on
Jan 22, 2024
Sold by
Parrish Ronnie
Bought by
Bell Joseph Aloysius and Brown Darnetta Latrice
Current Estimated Value
Home Financials for this Owner
Home Financials are based on the most recent Mortgage that was taken out on this home.
Original Mortgage
$10,500
Outstanding Balance
$10,294
Interest Rate
6.61%
Mortgage Type
New Conventional
Estimated Equity
$290,293
Purchase Details
Closed on
Oct 10, 2018
Sold by
Smith Leo Reginald
Bought by
Parrish Ronnie
Home Financials for this Owner
Home Financials are based on the most recent Mortgage that was taken out on this home.
Original Mortgage
$149,246
Interest Rate
4.75%
Mortgage Type
FHA
Purchase Details
Closed on
Jul 31, 1995
Sold by
Schlossberg Neil Shelley
Bought by
Smith Leo Cynthia
Create a Home Valuation Report for This Property
The Home Valuation Report is an in-depth analysis detailing your home's value as well as a comparison with similar homes in the area
Home Values in the Area
Average Home Value in this Area
Purchase History
| Date | Buyer | Sale Price | Title Company |
|---|---|---|---|
| Bell Joseph Aloysius | $300,000 | -- | |
| Parrish Ronnie | $152,000 | -- | |
| Smith Leo Cynthia | $91,000 | -- |
Source: Public Records
Mortgage History
| Date | Status | Borrower | Loan Amount |
|---|---|---|---|
| Open | Bell Joseph Aloysius | $10,500 | |
| Open | Bell Joseph Aloysius | $294,566 | |
| Previous Owner | Parrish Ronnie | $149,246 | |
| Closed | Smith Leo Cynthia | $0 |
Source: Public Records
Tax History Compared to Growth
Tax History
| Year | Tax Paid | Tax Assessment Tax Assessment Total Assessment is a certain percentage of the fair market value that is determined by local assessors to be the total taxable value of land and additions on the property. | Land | Improvement |
|---|---|---|---|---|
| 2024 | $2,898 | $119,080 | $17,600 | $101,480 |
| 2023 | $2,952 | $124,880 | $20,400 | $104,480 |
| 2022 | $2,372 | $102,280 | $16,560 | $85,720 |
| 2021 | $2,050 | $84,640 | $11,600 | $73,040 |
| 2020 | $1,742 | $72,480 | $10,000 | $62,480 |
| 2019 | $2,599 | $57,520 | $6,000 | $51,520 |
| 2018 | $925 | $44,320 | $6,000 | $38,320 |
| 2017 | $797 | $39,840 | $6,000 | $33,840 |
| 2016 | $543 | $33,160 | $6,000 | $27,160 |
| 2015 | $520 | $32,320 | $4,600 | $27,720 |
| 2014 | $470 | $32,320 | $4,600 | $27,720 |
| 2013 | -- | $46,200 | $7,200 | $39,000 |
Source: Public Records
Map
Nearby Homes
- 1420 Hillside Place SE
- 1508 Hillside Dr SE
- 1601 Creek Crossing SE
- 2631 Rolling Hills Way SE
- 1511 Hillside Dr SE
- 2617 Laurel Woods Ln SE Unit 3
- 340 Windsor Walk SE
- 309 Windsor Walk SE Unit 1
- 2717 Stanton Woods Dr SE
- 2537 Lennox Rd SE
- 250 Smile Dr SE
- 574 Almand Branch Rd SE Unit 1
- 2608 Downing Park Dr SE
- 2464 Lennox Rd SE
- 2851 Stanton Rd SE
- 784 Stieff Ct SE
- 2910 Stanton Rd SE
- 549 Greenview Ave SE
- Boston Plan at Millers Pointe
- 1911 Colestock Ave SE
- 0 Rolling Hill Trail Unit 8445655
- 1731 Rolling Hills Trail SE
- 1711 Rolling Hills Trail SE
- 1741 Rolling Hills Trail SE
- 1510 Marshall Ln SE
- 1520 Marshall Ln SE
- 1720 Rolling Hills Trail SE
- 1730 Rolling Hills Trail SE
- 1500 Marshall Ln SE
- 1530 Marshall Ln SE
- 1710 Rolling Hills Trail SE
- 1660 Creek Crossing SE
- 1751 Rolling Hills Trail SE
- 1650 Creek Crossing SE
- 1540 Marshall Ln SE
- 1740 Rolling Hills Trail SE
- 1551 Pin Oak Ln SE
- 1541 Pin Oak Ln SE
- 0 Marshall Ln SE Unit 3209990
- 0 Marshall Ln SE Unit 8731492