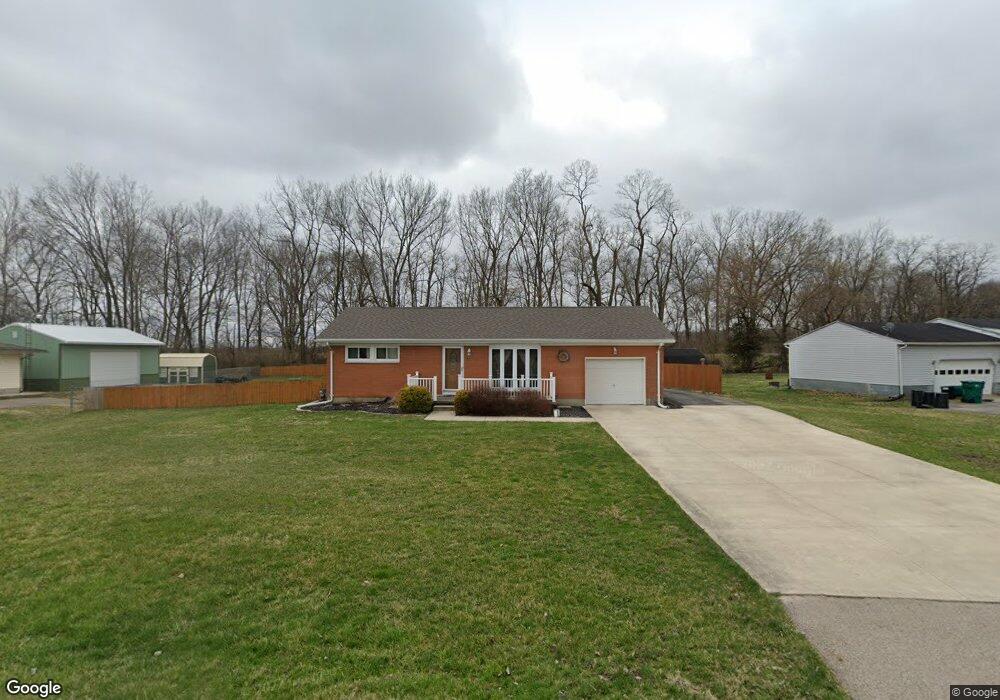
1721 Tremont City Rd Springfield, OH 45502
Estimated Value: $221,621 - $281,000
3
Beds
2
Baths
1,358
Sq Ft
$185/Sq Ft
Est. Value
About This Home
This home is located at 1721 Tremont City Rd, Springfield, OH 45502 and is currently estimated at $250,655, approximately $184 per square foot. 1721 Tremont City Rd is a home located in Clark County with nearby schools including Northwestern Elementary School, Northwestern Junior/Senior High School, and Ridgewood School.
Ownership History
Date
Name
Owned For
Owner Type
Purchase Details
Closed on
Feb 25, 2025
Sold by
Shaw Charles R and Shaw Jill M
Bought by
Shaw Charles R and Shaw Jill M
Current Estimated Value
Purchase Details
Closed on
Jun 20, 2017
Sold by
Castle Jeffrey A and Castle Kimberly S
Bought by
Shaw Charles R and Shaw Jill M
Home Financials for this Owner
Home Financials are based on the most recent Mortgage that was taken out on this home.
Original Mortgage
$100,000
Interest Rate
4.02%
Mortgage Type
New Conventional
Purchase Details
Closed on
Oct 20, 2010
Sold by
Mulkey Barbara Jean and Mulkey Barbara J
Bought by
Castle Jeffery A
Home Financials for this Owner
Home Financials are based on the most recent Mortgage that was taken out on this home.
Original Mortgage
$68,000
Interest Rate
4.37%
Mortgage Type
Future Advance Clause Open End Mortgage
Purchase Details
Closed on
Apr 28, 1994
Sold by
Mulkey Raymond Lee
Bought by
Mulkey Barbara Jean
Create a Home Valuation Report for This Property
The Home Valuation Report is an in-depth analysis detailing your home's value as well as a comparison with similar homes in the area
Home Values in the Area
Average Home Value in this Area
Purchase History
| Date | Buyer | Sale Price | Title Company |
|---|---|---|---|
| Shaw Charles R | -- | None Listed On Document | |
| Shaw Charles R | -- | None Listed On Document | |
| Shaw Charles R | $125,000 | Vantage Land Title | |
| Castle Jeffery A | $85,000 | Attorney | |
| Mulkey Barbara Jean | -- | -- |
Source: Public Records
Mortgage History
| Date | Status | Borrower | Loan Amount |
|---|---|---|---|
| Previous Owner | Shaw Charles R | $100,000 | |
| Previous Owner | Castle Jeffery A | $68,000 |
Source: Public Records
Tax History Compared to Growth
Tax History
| Year | Tax Paid | Tax Assessment Tax Assessment Total Assessment is a certain percentage of the fair market value that is determined by local assessors to be the total taxable value of land and additions on the property. | Land | Improvement |
|---|---|---|---|---|
| 2024 | $2,735 | $59,830 | $10,680 | $49,150 |
| 2023 | $2,735 | $59,830 | $10,680 | $49,150 |
| 2022 | $2,809 | $59,830 | $10,680 | $49,150 |
| 2021 | $2,388 | $45,200 | $8,150 | $37,050 |
| 2020 | $2,412 | $45,200 | $8,150 | $37,050 |
| 2019 | $2,390 | $45,200 | $8,150 | $37,050 |
| 2018 | $2,117 | $39,360 | $7,410 | $31,950 |
| 2017 | $2,175 | $39,358 | $7,406 | $31,952 |
| 2016 | $2,132 | $39,358 | $7,406 | $31,952 |
| 2015 | $2,099 | $38,745 | $7,406 | $31,339 |
| 2014 | $2,098 | $38,745 | $7,406 | $31,339 |
| 2013 | $2,083 | $38,745 | $7,406 | $31,339 |
Source: Public Records
Map
Nearby Homes
- 30 Center St
- 6250 Willowdale Rd
- 4211 Grey Stone Crossing
- 4328 Pine Tree Place
- 593 Hiser Ave
- 3802 Lawrenceville Dr
- 794 Donnelly Ave
- 4514 Dowden St
- 5646 Springfield-Urbana Pike Unit Lot 88
- 5646 Springfield-Urbana Pike Unit Lot 122
- 5646 Springfield-Urbana Pike Unit Lot 61
- 5646 Springfield-Urbana Pike Unit Lot 127
- 5646 Springfield-Urbana Pike Unit Lot 72
- 880 Brendle Trace Unit 28
- 916 Sawmill Ct
- 26 Thomaston Trail
- 4100 Troy Rd Unit 96
- 4100 Troy Rd Unit 12
- 970 Forest Edge Ave