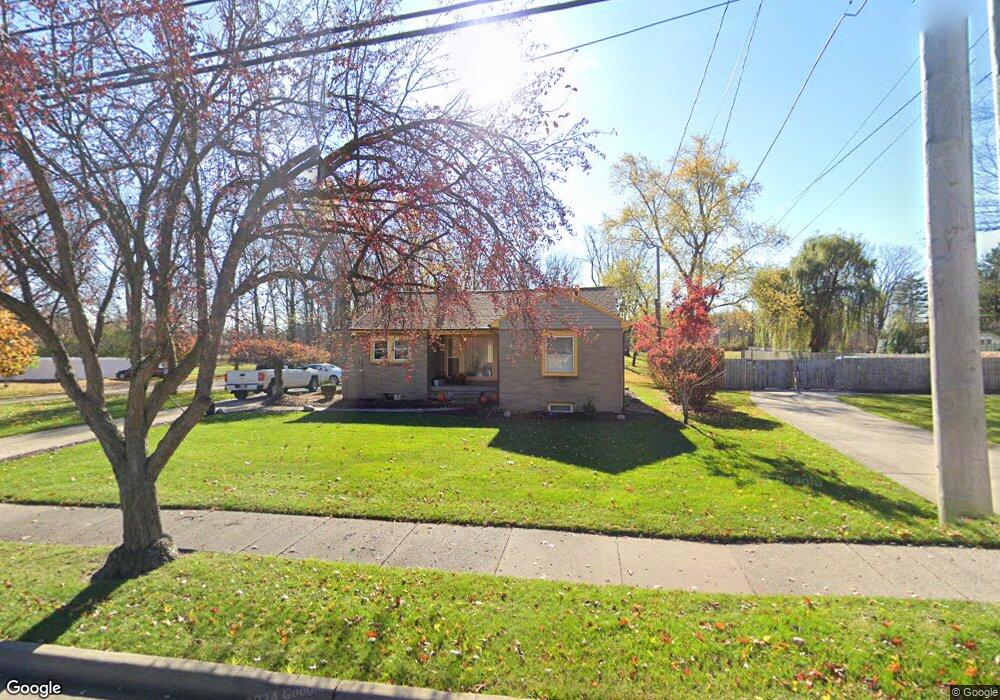
1721 W Holmes Rd Unit 5 Lansing, MI 48910
Pleasant Grove NeighborhoodEstimated Value: $126,000 - $167,099
--
Bed
1
Bath
1,270
Sq Ft
$110/Sq Ft
Est. Value
About This Home
This home is located at 1721 W Holmes Rd Unit 5, Lansing, MI 48910 and is currently estimated at $140,025, approximately $110 per square foot. 1721 W Holmes Rd Unit 5 is a home located in Ingham County with nearby schools including Reo Elementary School, Attwood School, and Everett High School.
Ownership History
Date
Name
Owned For
Owner Type
Purchase Details
Closed on
Oct 22, 2024
Sold by
Delaney Real Estate Investments Llc
Bought by
Wirebaugh Ronald
Current Estimated Value
Home Financials for this Owner
Home Financials are based on the most recent Mortgage that was taken out on this home.
Original Mortgage
$118,500
Outstanding Balance
$117,218
Interest Rate
6.2%
Mortgage Type
New Conventional
Estimated Equity
$22,807
Purchase Details
Closed on
Dec 27, 2019
Sold by
Sidebottom Clay and Sidebottom Tonyua
Bought by
Delaney Real Estate Investments
Purchase Details
Closed on
Aug 7, 2019
Sold by
Ray Sidney R
Bought by
Sidebottom Clay R
Purchase Details
Closed on
Nov 8, 2016
Sold by
Sidebottom Clay Robert
Bought by
Batts Dawn Lynn and Ray Sidney R
Purchase Details
Closed on
Jul 20, 1991
Sold by
Barker William and Barker Rebecca
Bought by
Sidebottom
Create a Home Valuation Report for This Property
The Home Valuation Report is an in-depth analysis detailing your home's value as well as a comparison with similar homes in the area
Home Values in the Area
Average Home Value in this Area
Purchase History
| Date | Buyer | Sale Price | Title Company |
|---|---|---|---|
| Wirebaugh Ronald | $125,000 | Liberty Title | |
| Delaney Real Estate Investments | $38,600 | Ata National Title Group Llc | |
| Sidebottom Clay R | -- | None Available | |
| Sidebottom Clay R | -- | None Available | |
| Batts Dawn Lynn | -- | None Available | |
| Sidebottom | $35,900 | -- |
Source: Public Records
Mortgage History
| Date | Status | Borrower | Loan Amount |
|---|---|---|---|
| Open | Wirebaugh Ronald | $118,500 | |
| Closed | Batts Dawn Lynn | $0 |
Source: Public Records
Tax History Compared to Growth
Tax History
| Year | Tax Paid | Tax Assessment Tax Assessment Total Assessment is a certain percentage of the fair market value that is determined by local assessors to be the total taxable value of land and additions on the property. | Land | Improvement |
|---|---|---|---|---|
| 2025 | $3,187 | $64,100 | $12,600 | $51,500 |
| 2024 | $26 | $54,400 | $12,600 | $41,800 |
| 2023 | $2,999 | $46,500 | $12,600 | $33,900 |
| 2022 | $2,738 | $42,400 | $10,800 | $31,600 |
| 2021 | $2,674 | $37,000 | $6,600 | $30,400 |
| 2020 | $2,656 | $32,800 | $6,600 | $26,200 |
| 2019 | $3,087 | $29,900 | $6,600 | $23,300 |
| 2018 | $1,659 | $27,200 | $6,600 | $20,600 |
| 2017 | $2,280 | $27,200 | $6,600 | $20,600 |
| 2016 | $1,510 | $26,400 | $6,600 | $19,800 |
| 2015 | $1,510 | $25,400 | $13,166 | $12,234 |
| 2014 | $1,510 | $26,300 | $22,569 | $3,731 |
Source: Public Records
Map
Nearby Homes
- 1301 Warwick Dr
- 1321 Pompton Cir
- VL Hillcrest St
- 2029 Hillcrest St
- 3312 Pleasant Grove Rd
- 3125 Boston Blvd
- 1113 Eaton Ct
- 1607 Holly Way
- 1500 Pierce Rd
- 0 Eaton Ct
- 1422 Pierce Rd
- 1429 Pierce Rd
- 4017 Richmond St
- 3336 Avalon St
- 3330 Avalon St
- 2039 Holly Way
- 924 Loa St
- 4110 Richmond St
- 4221 S Martin Luther King Junior Blvd
- 2311 Greenbelt Dr
- 1721 W Holmes Rd
- 1721-1/2 W Holmes Rd
- 1733 W Holmes Rd
- 1615 W Holmes Rd
- 1809 W Holmes Rd
- 1720 W Holmes Rd
- 1734 W Holmes Rd
- 1813 W Holmes Rd
- 1738 W Holmes Rd
- 1817 W Holmes Rd
- 1618 W Holmes Rd
- 1821 W Holmes Rd
- 1522 W Holmes Rd
- 1812 W Holmes Rd
- 1827 W Holmes Rd
- 1522 W West Holmes
- 14 W Holmes Rd
- 1901 W Holmes Rd
- 1822 W Holmes Rd