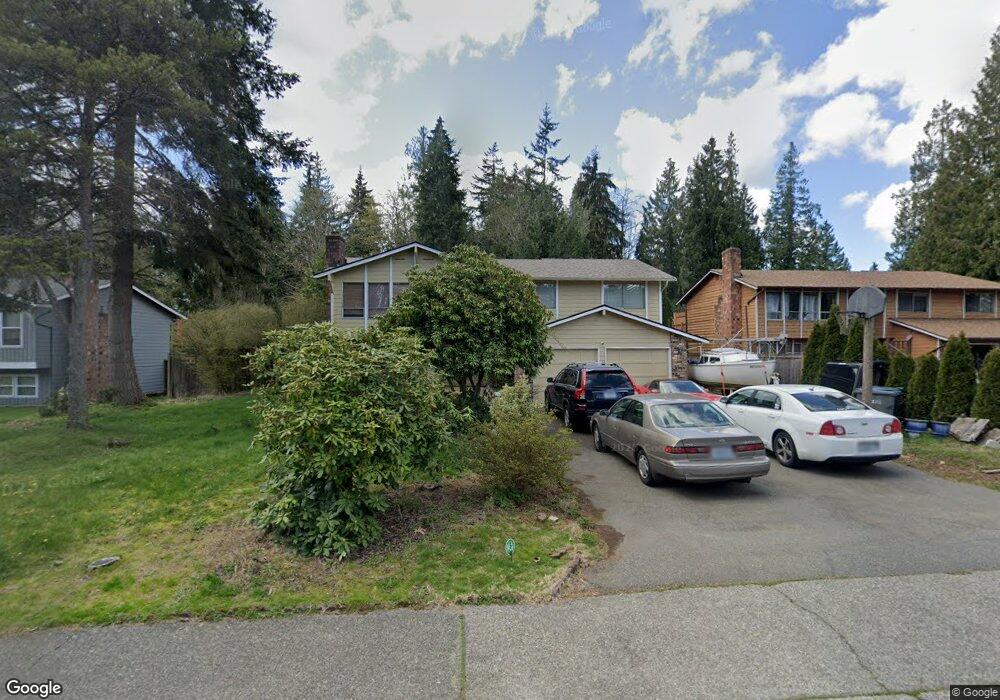
17210 30th Dr SE Bothell, WA 98012
North Creek NeighborhoodEstimated Value: $831,809 - $896,000
3
Beds
3
Baths
2,040
Sq Ft
$428/Sq Ft
Est. Value
About This Home
This home is located at 17210 30th Dr SE, Bothell, WA 98012 and is currently estimated at $872,702, approximately $427 per square foot. 17210 30th Dr SE is a home located in Snohomish County with nearby schools including Cedar Wood Elementary School, Heatherwood Middle School, and Henry M. Jackson High School.
Ownership History
Date
Name
Owned For
Owner Type
Purchase Details
Closed on
Oct 21, 2005
Sold by
Thai Phuoc
Bought by
Thai Phuoc T and Ngo Tuyet M
Current Estimated Value
Home Financials for this Owner
Home Financials are based on the most recent Mortgage that was taken out on this home.
Original Mortgage
$116,000
Outstanding Balance
$59,860
Interest Rate
5.68%
Mortgage Type
New Conventional
Estimated Equity
$812,842
Purchase Details
Closed on
Oct 15, 2001
Sold by
Ngo Tuyet
Bought by
Thai Phuoc
Home Financials for this Owner
Home Financials are based on the most recent Mortgage that was taken out on this home.
Original Mortgage
$134,000
Interest Rate
6.88%
Purchase Details
Closed on
Oct 22, 1999
Sold by
Vine Kimberly L
Bought by
Thai Phuoc and Ngo Tuyet
Home Financials for this Owner
Home Financials are based on the most recent Mortgage that was taken out on this home.
Original Mortgage
$133,500
Interest Rate
7.82%
Purchase Details
Closed on
May 27, 1999
Sold by
Vine Ernest C and Vine Helen B
Bought by
Vine Kimberly L
Create a Home Valuation Report for This Property
The Home Valuation Report is an in-depth analysis detailing your home's value as well as a comparison with similar homes in the area
Home Values in the Area
Average Home Value in this Area
Purchase History
| Date | Buyer | Sale Price | Title Company |
|---|---|---|---|
| Thai Phuoc T | $56,179 | Transnation Title | |
| Thai Phuoc | -- | Stewart Title Company | |
| Thai Phuoc | $222,500 | -- | |
| Vine Kimberly L | -- | Chicago Title Insurance Co |
Source: Public Records
Mortgage History
| Date | Status | Borrower | Loan Amount |
|---|---|---|---|
| Open | Thai Phuoc T | $116,000 | |
| Closed | Thai Phuoc | $134,000 | |
| Previous Owner | Thai Phuoc | $133,500 |
Source: Public Records
Tax History
| Year | Tax Paid | Tax Assessment Tax Assessment Total Assessment is a certain percentage of the fair market value that is determined by local assessors to be the total taxable value of land and additions on the property. | Land | Improvement |
|---|---|---|---|---|
| 2026 | $7,468 | $834,500 | $566,500 | $268,000 |
| 2025 | $6,991 | $772,800 | $515,000 | $257,800 |
| 2024 | $6,991 | $726,400 | $470,000 | $256,400 |
| 2023 | $7,203 | $820,800 | $545,000 | $275,800 |
| 2022 | $6,075 | $598,500 | $365,000 | $233,500 |
| 2020 | $6,012 | $498,100 | $293,000 | $205,100 |
| 2019 | $5,564 | $462,100 | $275,000 | $187,100 |
| 2018 | $5,589 | $423,200 | $235,000 | $188,200 |
| 2017 | $4,852 | $369,400 | $195,000 | $174,400 |
| 2016 | $4,221 | $337,200 | $170,000 | $167,200 |
| 2015 | $4,233 | $320,700 | $169,000 | $151,700 |
| 2013 | $3,452 | $230,400 | $124,000 | $106,400 |
Source: Public Records
Map
Nearby Homes
- 17001 31st Dr SE
- 3414 176th Place SE
- 17116 35th Dr SE Unit C6
- 17116 35th Dr SE Unit C2
- 17116 35th Dr SE Unit A2
- 17715 2nd Ave W
- 3205 179th Place SE
- 3701 170th Place SE
- 16606 35th Ave SE Unit 9A
- 2502 166th Place SE
- 17529 Brook Blvd
- 18115 34th Dr SE
- 18223 31st Ave SE
- 17321 40th Ave SE
- 3918 177th St SE
- 18309 26th Dr SE
- 17913 38th Dr SE Unit 20
- 3028 183rd Place SE
- 16519 37th Dr SE
- 4003 168th Place SE
- 17218 30th Dr SE
- 17206 30th Dr SE
- 17226 30th Dr SE
- 17128 30th Dr SE
- 3002 171st Place SE
- 17211 30th Dr SE
- 17205 30th Dr SE
- 17221 30th Dr SE
- 17302 30th Dr SE
- 2930 171st Place SE
- 17125 30th Dr SE
- 17227 30th Dr SE
- 17210 31st Dr SE
- 17216 31st Dr SE
- 17303 30th Dr SE
- 17119 30th Dr SE
- 17308 30th Dr SE
- 17204 31st Dr SE
- 17222 31st Dr SE
- 17132 31st Dr SE
Your Personal Tour Guide
Ask me questions while you tour the home.