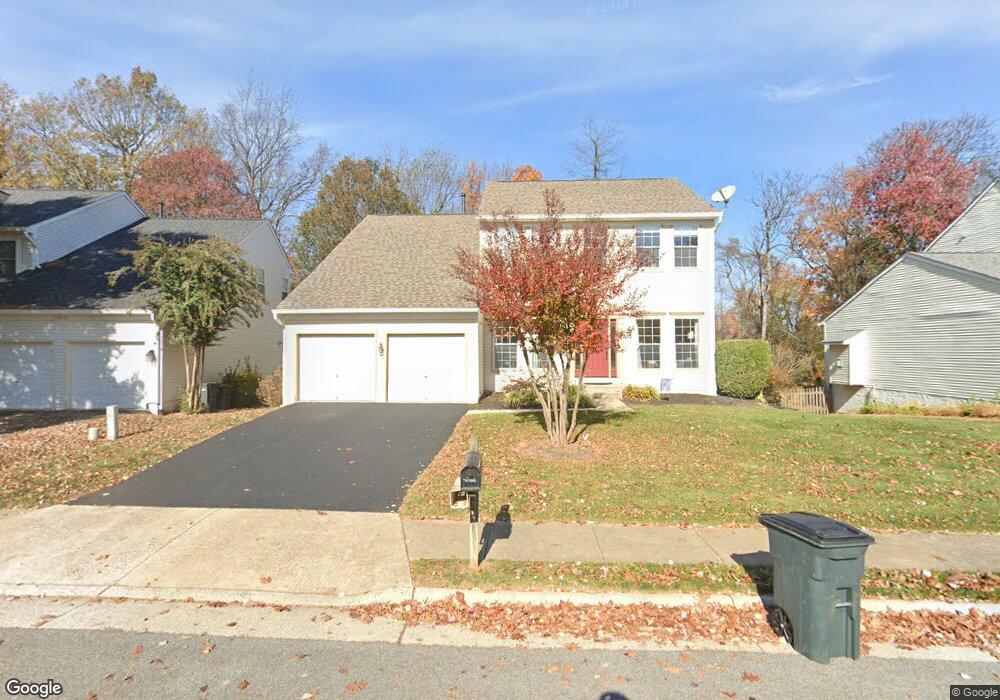
17213 Pickwick Dr Purcellville, VA 20132
Estimated Value: $760,090 - $854,000
4
Beds
4
Baths
2,346
Sq Ft
$343/Sq Ft
Est. Value
About This Home
This home is located at 17213 Pickwick Dr, Purcellville, VA 20132 and is currently estimated at $805,773, approximately $343 per square foot. 17213 Pickwick Dr is a home located in Loudoun County with nearby schools including Kenneth W. Culbert Elementary School, Blue Ridge Middle School, and Loudoun Valley High School.
Ownership History
Date
Name
Owned For
Owner Type
Purchase Details
Closed on
Apr 6, 2016
Sold by
Canan Timothy F and Canan Aileen P
Bought by
The Canan Trust A Revocable Joint Trust
Current Estimated Value
Purchase Details
Closed on
Nov 22, 2004
Sold by
Stone Robert D
Bought by
Canan Timothy F
Home Financials for this Owner
Home Financials are based on the most recent Mortgage that was taken out on this home.
Original Mortgage
$396,000
Interest Rate
5.8%
Mortgage Type
New Conventional
Purchase Details
Closed on
Sep 30, 1999
Sold by
Richmond American
Bought by
Stone Robert D
Home Financials for this Owner
Home Financials are based on the most recent Mortgage that was taken out on this home.
Original Mortgage
$203,000
Interest Rate
7.85%
Create a Home Valuation Report for This Property
The Home Valuation Report is an in-depth analysis detailing your home's value as well as a comparison with similar homes in the area
Home Values in the Area
Average Home Value in this Area
Purchase History
| Date | Buyer | Sale Price | Title Company |
|---|---|---|---|
| The Canan Trust A Revocable Joint Trust | -- | None Available | |
| Canan Timothy F | $495,000 | -- | |
| Stone Robert D | $217,080 | -- |
Source: Public Records
Mortgage History
| Date | Status | Borrower | Loan Amount |
|---|---|---|---|
| Previous Owner | Canan Timothy F | $396,000 | |
| Previous Owner | Stone Robert D | $203,000 |
Source: Public Records
Tax History Compared to Growth
Tax History
| Year | Tax Paid | Tax Assessment Tax Assessment Total Assessment is a certain percentage of the fair market value that is determined by local assessors to be the total taxable value of land and additions on the property. | Land | Improvement |
|---|---|---|---|---|
| 2025 | $6,169 | $738,840 | $212,000 | $526,840 |
| 2024 | $6,161 | $688,350 | $212,000 | $476,350 |
| 2023 | $5,379 | $614,780 | $212,000 | $402,780 |
| 2022 | $5,212 | $585,580 | $184,800 | $400,780 |
| 2021 | $5,097 | $520,070 | $144,800 | $375,270 |
| 2020 | $4,860 | $469,520 | $144,800 | $324,720 |
| 2019 | $4,687 | $448,540 | $124,800 | $323,740 |
| 2018 | $4,603 | $424,270 | $124,800 | $299,470 |
| 2017 | $4,683 | $416,290 | $124,800 | $291,490 |
| 2016 | $4,704 | $410,810 | $0 | $0 |
| 2015 | $4,652 | $285,090 | $0 | $285,090 |
| 2014 | $4,636 | $276,590 | $0 | $276,590 |
Source: Public Records
Map
Nearby Homes
- 15334 Berlin Turnpike
- 17313 Pickwick Dr
- 133 Misty Pond Terrace
- 104 Mcilhaney Way
- 525 Wordsworth Cir
- 300 N Old Dominion Ln
- 102 Frazer Dr
- 14691 Fordson Ct
- 14649 Fordson Ct
- 14629 Fordson Ct
- 485 Wordsworth Cir
- 120 Oliver Ct
- 221 S Maple Ave
- 300 E Loudoun Valley Dr
- 205 E Skyline Dr
- 608 E G St
- 116 Desales Dr
- 161 N Hatcher Ave
- 619 Greysands Ln
- 17348 Harmony Vista Dr
- 17209 Pickwick Dr
- 17217 Pickwick Dr
- 17221 Pickwick Dr
- 17205 Pickwick Dr
- 37757 Drawbridge Way
- 37756 Drawbridge Way
- 17201 Pickwick Dr
- 17248 Pickwick Dr
- 17225 Pickwick Dr
- 17236 Pickwick Dr
- 37761 Drawbridge Way
- 17197 Pickwick Dr
- 37760 Drawbridge Way
- 17229 Pickwick Dr
- 17252 Pickwick Dr
- 37764 Drawbridge Way
- 17232 Pickwick Dr
- 17233 Pickwick Dr
- 37765 Drawbridge Way
- 17193 Pickwick Dr