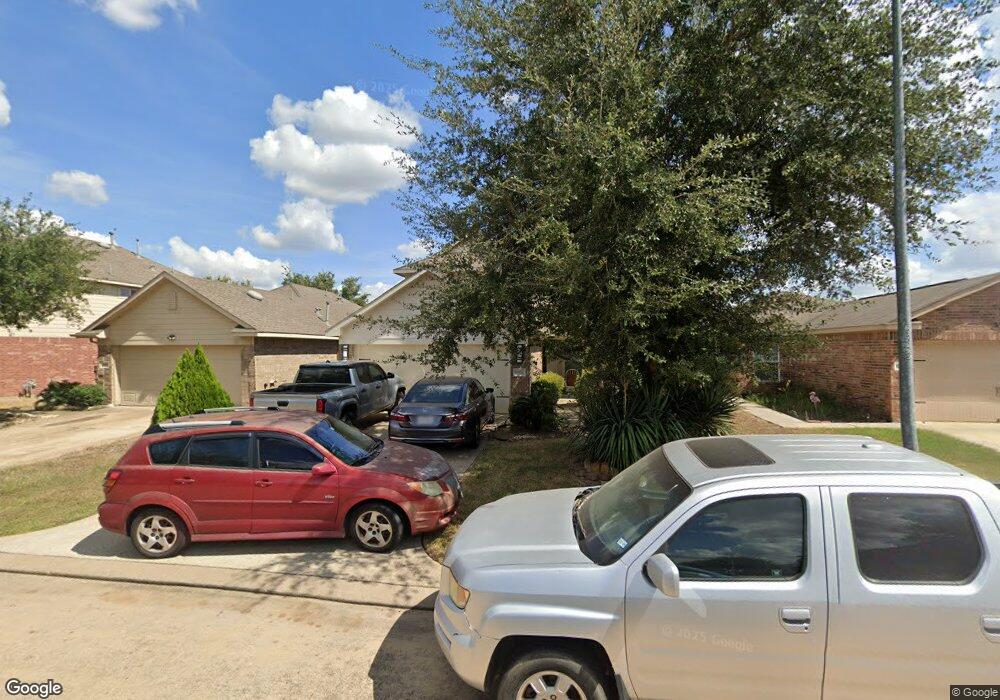
17214 Osprey Landing Dr Hockley, TX 77447
Hockley NeighborhoodEstimated Value: $246,000 - $248,000
4
Beds
3
Baths
1,796
Sq Ft
$138/Sq Ft
Est. Value
About This Home
This home is located at 17214 Osprey Landing Dr, Hockley, TX 77447 and is currently estimated at $247,066, approximately $137 per square foot. 17214 Osprey Landing Dr is a home located in Harris County with nearby schools including Roberts Road Elementary School, Waller Junior High School, and Waller High School.
Ownership History
Date
Name
Owned For
Owner Type
Purchase Details
Closed on
Jan 31, 2020
Sold by
Robles Luis Humberto and Robles Luis H
Bought by
Medina Luz Elba and Robles Luz Elba
Current Estimated Value
Purchase Details
Closed on
Sep 9, 2017
Sold by
Diaz Reyna Eduardo
Bought by
Medina Luz Elba
Purchase Details
Closed on
Dec 19, 2012
Sold by
Jpmorgan Chase Bank Na
Bought by
Medina Luz Eiba
Purchase Details
Closed on
Aug 7, 2012
Sold by
Frias Lucilla A and Frias Luis
Bought by
Jp Morgan Chase Bank National Assn
Purchase Details
Closed on
Jun 22, 2010
Sold by
Lennar Homes Of Texas Land & Constructio
Bought by
Frias Lucilla A
Home Financials for this Owner
Home Financials are based on the most recent Mortgage that was taken out on this home.
Original Mortgage
$123,459
Interest Rate
4.87%
Mortgage Type
New Conventional
Create a Home Valuation Report for This Property
The Home Valuation Report is an in-depth analysis detailing your home's value as well as a comparison with similar homes in the area
Home Values in the Area
Average Home Value in this Area
Purchase History
| Date | Buyer | Sale Price | Title Company |
|---|---|---|---|
| Medina Luz Elba | -- | First American Title | |
| Medina Luz Elba | -- | None Available | |
| Medina Luz Eiba | -- | Lsi Title Agency Inc | |
| Jp Morgan Chase Bank National Assn | $88,400 | None Available | |
| Frias Lucilla A | -- | Startex 05 Title Company |
Source: Public Records
Mortgage History
| Date | Status | Borrower | Loan Amount |
|---|---|---|---|
| Previous Owner | Frias Lucilla A | $123,459 |
Source: Public Records
Tax History Compared to Growth
Tax History
| Year | Tax Paid | Tax Assessment Tax Assessment Total Assessment is a certain percentage of the fair market value that is determined by local assessors to be the total taxable value of land and additions on the property. | Land | Improvement |
|---|---|---|---|---|
| 2025 | $4,640 | $250,804 | $39,820 | $210,984 |
| 2024 | $4,640 | $251,354 | $39,820 | $211,534 |
| 2023 | $4,640 | $269,143 | $39,820 | $229,323 |
| 2022 | $5,364 | $227,745 | $34,100 | $193,645 |
| 2021 | $5,106 | $183,131 | $26,400 | $156,731 |
| 2020 | $4,793 | $166,041 | $26,400 | $139,641 |
| 2019 | $4,837 | $162,036 | $22,000 | $140,036 |
| 2018 | $1,095 | $154,653 | $18,920 | $135,733 |
| 2017 | $4,570 | $154,653 | $18,920 | $135,733 |
| 2016 | $4,570 | $154,653 | $18,920 | $135,733 |
| 2015 | $2,131 | $127,040 | $18,920 | $108,120 |
| 2014 | $2,131 | $106,327 | $17,600 | $88,727 |
Source: Public Records
Map
Nearby Homes
- 17222 Osprey Landing Dr
- 17135 Falcons Nest Landing Dr
- 24402 Bar Kay Ln
- 24503 Wild Horse Ln
- 24335 Palm Cockatoo Dr
- 24519 Cypresspark Glen Ln
- 24231 Wild Horse Ln
- 17247 Osprey Forest Dr
- 24303 Four Sixes Ln
- 2076 Stallion Lakes Ave
- 24211 Four Sixes Ln
- 24010 Palo Dura Dr
- 24402 Jumping Jay Dr
- 17506 Bullis Gap Dr
- 24310 Rockin Seven Dr
- 24414 Broken Bow Ln
- 0 Lazy Kay Ln
- 24039 Rockin Seven Dr
- 17607 Lavender Blossom Ln
- 17603 Lavender Blossom Ln
- 17210 Osprey Landing Dr
- 17206 Osprey Landing Dr
- 17215 Falcons Nest Landing Dr
- 17211 Falcons Nest Landing Dr
- 17219 Falcons Nest Landing Dr
- 17226 Osprey Landing Dr
- 17202 Osprey Landing Dr
- 17207 Falcons Nest Landing Dr
- 17223 Falcons Nest Landing Dr
- 17223 Osprey Landing Dr
- 17203 Falcons Nest Landing Dr
- 17227 Falcons Nest Landing Dr
- 17219 Osprey Landing Dr
- 17247 Osprey Landing Dr
- 17211 Osprey Landing Dr
- 17138 Osprey Landing Dr
- 17207 Osprey Landing Dr
- 17231 Falcons Nest Landing Dr
- 17227 Osprey Landing Dr
- 17134 Osprey Landing Dr