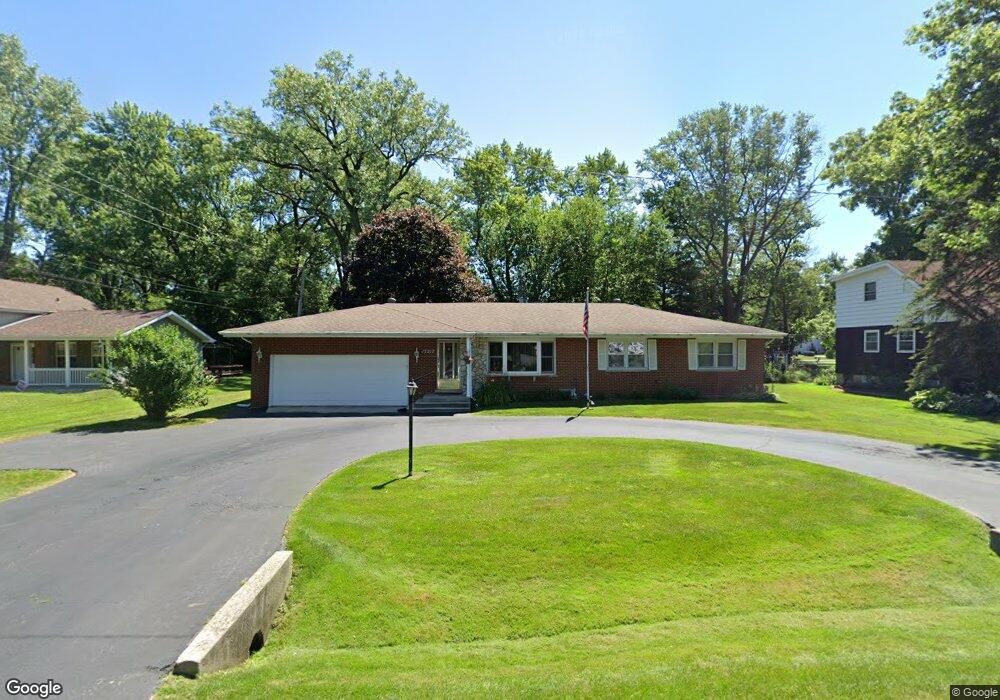
17217 Loomis Ave Hazel Crest, IL 60429
Estimated Value: $186,000 - $256,000
3
Beds
1
Bath
1,636
Sq Ft
$131/Sq Ft
Est. Value
About This Home
This home is located at 17217 Loomis Ave, Hazel Crest, IL 60429 and is currently estimated at $213,838, approximately $130 per square foot. 17217 Loomis Ave is a home located in Cook County with nearby schools including Thornwood High School.
Ownership History
Date
Name
Owned For
Owner Type
Purchase Details
Closed on
Sep 4, 2007
Sold by
Minnis Helen M
Bought by
Minnis Helen M and Helen M Minnis Family Trust
Current Estimated Value
Purchase Details
Closed on
Mar 21, 2003
Sold by
Dutour Betty M
Bought by
Minnis Helen M
Home Financials for this Owner
Home Financials are based on the most recent Mortgage that was taken out on this home.
Original Mortgage
$105,750
Outstanding Balance
$37,648
Interest Rate
3.87%
Estimated Equity
$176,190
Create a Home Valuation Report for This Property
The Home Valuation Report is an in-depth analysis detailing your home's value as well as a comparison with similar homes in the area
Home Values in the Area
Average Home Value in this Area
Purchase History
| Date | Buyer | Sale Price | Title Company |
|---|---|---|---|
| Minnis Helen M | -- | None Available | |
| Minnis Helen M | $117,500 | Atgf Inc |
Source: Public Records
Mortgage History
| Date | Status | Borrower | Loan Amount |
|---|---|---|---|
| Open | Minnis Helen M | $105,750 |
Source: Public Records
Tax History
| Year | Tax Paid | Tax Assessment Tax Assessment Total Assessment is a certain percentage of the fair market value that is determined by local assessors to be the total taxable value of land and additions on the property. | Land | Improvement |
|---|---|---|---|---|
| 2025 | $3,447 | $12,600 | $2,634 | $9,966 |
| 2024 | $3,447 | $12,600 | $2,634 | $9,966 |
| 2023 | $2,162 | $12,600 | $2,634 | $9,966 |
| 2022 | $2,162 | $9,479 | $2,341 | $7,138 |
| 2021 | $2,226 | $9,479 | $2,341 | $7,138 |
| 2020 | $2,386 | $9,479 | $2,341 | $7,138 |
| 2019 | $1,283 | $8,318 | $2,048 | $6,270 |
| 2018 | $1,262 | $8,318 | $2,048 | $6,270 |
| 2017 | $1,333 | $8,318 | $2,048 | $6,270 |
| 2016 | $1,728 | $7,360 | $1,755 | $5,605 |
| 2015 | $3,994 | $7,360 | $1,755 | $5,605 |
| 2014 | $1,574 | $7,360 | $1,755 | $5,605 |
| 2013 | $2,453 | $9,501 | $1,755 | $7,746 |
Source: Public Records
Map
Nearby Homes
- 1409 172nd St
- 1411 172nd St
- 1307 173rd St
- 1514 173rd St
- 1113 171st St
- 1021 173rd St
- 17406 Lathrop Ave
- 17212 Hawthorne Dr
- 17092 Jodave Ave
- 16919 Wood St
- 17322 Forestway Dr
- 17092 Lincoln St
- 17308 Forestway Dr
- 1913 170th St
- 17046 Winchester Ave
- 1722 168th St
- 16963 Winchester Ave
- 1812 Cedar Rd
- 17866 Ashland Ave
- 16930 Winchester Ave
- 17211 Loomis Ave
- 1314 173rd St
- 17207 Loomis Ave
- 17216 Loomis Ave
- 1326 173rd St
- 17220 Loomis Ave
- 17205 Loomis Ave
- 1310 173rd St
- 17208 Loomis Ave
- 1402 173rd St
- 1312 173rd St
- 17201 Loomis Ave
- 1410 173rd St
- 1315 172nd St
- 1311 172nd St
- 17204 Loomis Ave
- 1308 173rd St
- 1309 172nd St
- 1411 173rd St
- 1315 173rd St
Your Personal Tour Guide
Ask me questions while you tour the home.