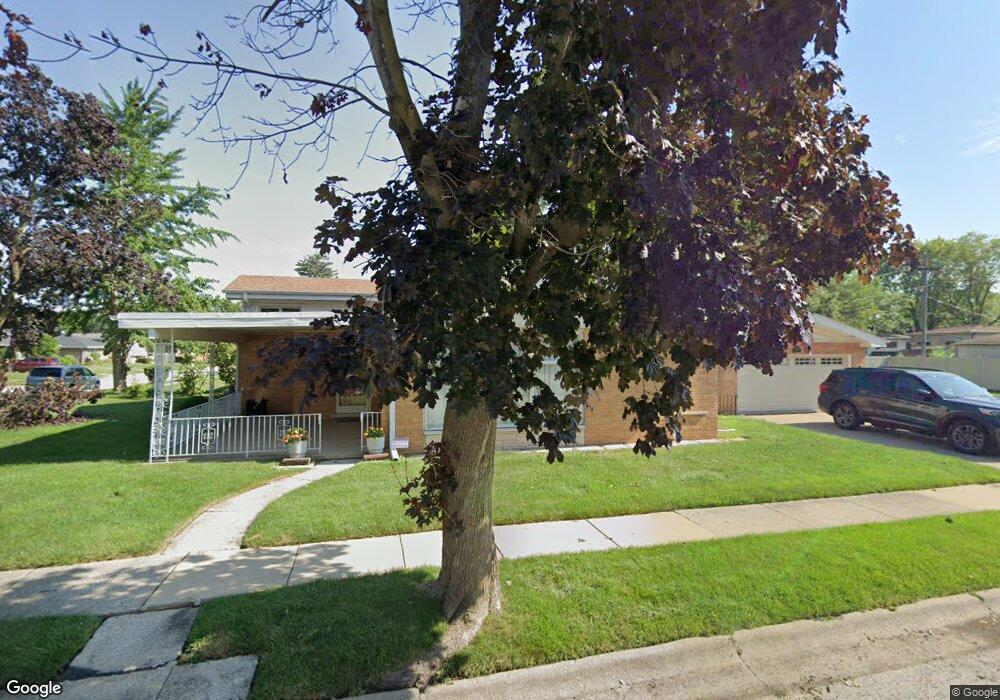
17219 Country Ln Hazel Crest, IL 60429
Estimated Value: $200,308 - $236,000
4
Beds
3
Baths
1,660
Sq Ft
$132/Sq Ft
Est. Value
About This Home
This home is located at 17219 Country Ln, Hazel Crest, IL 60429 and is currently estimated at $219,327, approximately $132 per square foot. 17219 Country Ln is a home located in Cook County with nearby schools including Thornwood High School.
Ownership History
Date
Name
Owned For
Owner Type
Purchase Details
Closed on
Oct 24, 1994
Sold by
Blakely Mary K
Bought by
Wideman Ronald S and Wideman Stephanie J
Current Estimated Value
Home Financials for this Owner
Home Financials are based on the most recent Mortgage that was taken out on this home.
Original Mortgage
$104,500
Interest Rate
9.25%
Create a Home Valuation Report for This Property
The Home Valuation Report is an in-depth analysis detailing your home's value as well as a comparison with similar homes in the area
Home Values in the Area
Average Home Value in this Area
Purchase History
| Date | Buyer | Sale Price | Title Company |
|---|---|---|---|
| Wideman Ronald S | $110,000 | -- |
Source: Public Records
Mortgage History
| Date | Status | Borrower | Loan Amount |
|---|---|---|---|
| Previous Owner | Wideman Ronald S | $104,500 |
Source: Public Records
Tax History Compared to Growth
Tax History
| Year | Tax Paid | Tax Assessment Tax Assessment Total Assessment is a certain percentage of the fair market value that is determined by local assessors to be the total taxable value of land and additions on the property. | Land | Improvement |
|---|---|---|---|---|
| 2024 | $6,593 | $16,000 | $4,144 | $11,856 |
| 2023 | $3,583 | $16,000 | $4,144 | $11,856 |
| 2022 | $3,583 | $8,927 | $3,626 | $5,301 |
| 2021 | $3,574 | $8,926 | $3,626 | $5,300 |
| 2020 | $3,568 | $8,926 | $3,626 | $5,300 |
| 2019 | $3,847 | $9,862 | $3,367 | $6,495 |
| 2018 | $3,801 | $9,862 | $3,367 | $6,495 |
| 2017 | $3,856 | $9,862 | $3,367 | $6,495 |
| 2016 | $3,467 | $8,676 | $3,108 | $5,568 |
| 2015 | $3,285 | $8,676 | $3,108 | $5,568 |
| 2014 | $3,251 | $8,676 | $3,108 | $5,568 |
| 2013 | $3,754 | $10,271 | $3,108 | $7,163 |
Source: Public Records
Map
Nearby Homes
- 17212 Hawthorne Dr
- 17222 Country Ln
- 1848 172nd St
- 17308 Forestway Dr
- 1903 171st St
- 1921 171st St
- 17046 Winchester Ave
- 1913 170th St
- 17064 Shea Ave
- 17026 Bulger Ave
- 2030 170th St
- 16930 Winchester Ave
- 16910 Lincoln St
- 16929 Wood St
- 1514 173rd St
- 16919 Wood St
- 2131 170th St
- 16918 Shea Ave
- 1710 169th St
- 17231 Laflin Ave
- 17213 Country Ln
- 17211 Country Ln
- 17218 Hawthorne Dr
- 17226 Country Ln
- 17216 Hawthorne Dr
- 17300 Hawthorne Dr
- 17209 Country Ln
- 17224 Country Ln
- 17302 Hawthorne Dr
- 17214 Hawthorne Dr
- 17216 Country Ln
- 17214 Country Ln
- 17218 Country Ln
- 17207 Country Ln
- 17304 Hawthorne Dr
- 17212 Country Ln
- 17220 Country Ln
- 17208 Country Ln
- 17205 Country Ln
- 17210 Hawthorne Dr