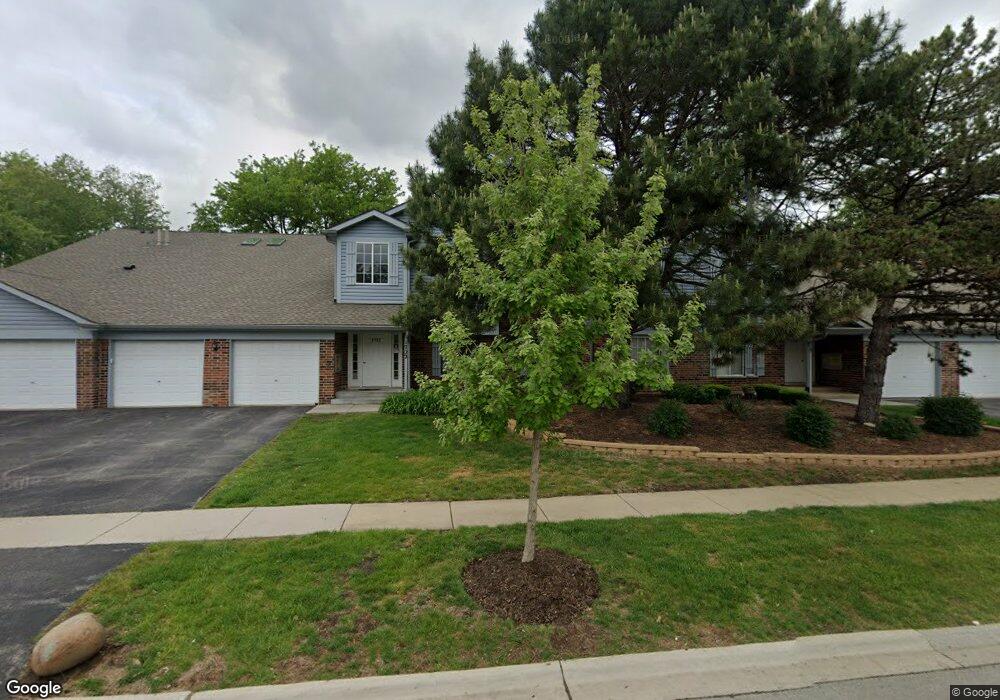
1722 Chesapeake Ln Unit 70081 Schaumburg, IL 60193
South Schaumburg NeighborhoodEstimated Value: $280,000 - $295,000
2
Beds
--
Bath
1,200
Sq Ft
$239/Sq Ft
Est. Value
About This Home
This home is located at 1722 Chesapeake Ln Unit 70081, Schaumburg, IL 60193 and is currently estimated at $286,575, approximately $238 per square foot. 1722 Chesapeake Ln Unit 70081 is a home located in Cook County with nearby schools including Hanover Highlands Elementary School, Robert Frost Junior High School, and Schaumburg High School.
Ownership History
Date
Name
Owned For
Owner Type
Purchase Details
Closed on
Sep 16, 2005
Sold by
Knopf Matthew L
Bought by
Bobrowski Nicole
Current Estimated Value
Home Financials for this Owner
Home Financials are based on the most recent Mortgage that was taken out on this home.
Original Mortgage
$175,100
Outstanding Balance
$93,502
Interest Rate
5.82%
Mortgage Type
Fannie Mae Freddie Mac
Estimated Equity
$193,073
Purchase Details
Closed on
Sep 27, 1999
Sold by
Djordjevic Dragica
Bought by
Knopf Matthew L
Purchase Details
Closed on
May 27, 1999
Sold by
Ouellet Lawrence J and Ouellet Ardith
Bought by
Knopf Matthew L and Djordjevic Dragica
Home Financials for this Owner
Home Financials are based on the most recent Mortgage that was taken out on this home.
Original Mortgage
$116,000
Interest Rate
6.62%
Create a Home Valuation Report for This Property
The Home Valuation Report is an in-depth analysis detailing your home's value as well as a comparison with similar homes in the area
Home Values in the Area
Average Home Value in this Area
Purchase History
| Date | Buyer | Sale Price | Title Company |
|---|---|---|---|
| Bobrowski Nicole | $195,000 | Cti | |
| Knopf Matthew L | -- | Djh Title & Abstract | |
| Knopf Matthew L | $122,500 | Professional National Title |
Source: Public Records
Mortgage History
| Date | Status | Borrower | Loan Amount |
|---|---|---|---|
| Open | Bobrowski Nicole | $175,100 | |
| Previous Owner | Knopf Matthew L | $116,000 |
Source: Public Records
Tax History Compared to Growth
Tax History
| Year | Tax Paid | Tax Assessment Tax Assessment Total Assessment is a certain percentage of the fair market value that is determined by local assessors to be the total taxable value of land and additions on the property. | Land | Improvement |
|---|---|---|---|---|
| 2024 | $4,294 | $18,645 | $2,409 | $16,236 |
| 2023 | $4,135 | $18,645 | $2,409 | $16,236 |
| 2022 | $4,135 | $18,645 | $2,409 | $16,236 |
| 2021 | $3,380 | $14,482 | $1,575 | $12,907 |
| 2020 | $3,390 | $14,482 | $1,575 | $12,907 |
| 2019 | $3,427 | $16,215 | $1,575 | $14,640 |
| 2018 | $2,294 | $11,079 | $1,297 | $9,782 |
| 2017 | $2,276 | $11,079 | $1,297 | $9,782 |
| 2016 | $2,371 | $11,079 | $1,297 | $9,782 |
| 2015 | $2,156 | $9,830 | $1,204 | $8,626 |
| 2014 | $2,149 | $9,830 | $1,204 | $8,626 |
| 2013 | $2,076 | $9,830 | $1,204 | $8,626 |
Source: Public Records
Map
Nearby Homes
- 1721 Chesapeake Ln Unit 4
- 1518 Harbour Ct Unit A1
- 1471 Fairlane Dr Unit 2A
- 1467 Fairlane Dr Unit 1B
- 1662 Commodore Ct Unit 70294
- 1460 Fairlane Dr Unit 228
- 1463 Mercury Dr Unit 115
- 1463 Mercury Dr Unit 304
- 6908 Orchard Ln
- 1410 Brownstone Place Unit 38
- 6915 Hawthorne Ln
- 7031 Glenwood Ln
- 1882 Keystone Place Unit 1882
- 6938 Meadowbrook Ln
- 6925 Edgebrook Ln
- 7468 Filmore Ave
- 1102 Westover Ln Unit 1C
- 7138 Edgebrook Ln
- 664 Wedgewood Dr
- 1011 Mercury Dr Unit 7
- 1722 Chesapeake Ln Unit 70082
- 1722 Chesapeake Ln Unit 70083
- 1722 Chesapeake Ln Unit 70084
- 1722 Chesapeake Ln Unit 3
- 1722 Chesapeake Ln Unit 2
- 1718 Chesapeake Ln Unit 70086
- 1718 Chesapeake Ln Unit 70088
- 1718 Chesapeake Ln Unit 70087
- 1718 Chesapeake Ln Unit 70085
- 1718 Chesapeake Ln Unit 5
- 1718 Chesapeake Ln Unit 8
- 1718 Chesapeake Ln Unit 6
- 1721 Chesapeake Ln
- 1721 Chesapeake Ln Unit 70171
- 1721 Chesapeake Ln Unit 70174
- 1721 Chesapeake Ln Unit 70172
- 1721 Chesapeake Ln Unit 70173
- 1721 Chesapeake Ln Unit 3
- 1721 Chesapeake Ln Unit 2
- 1721 Chesapeake Ln Unit 1