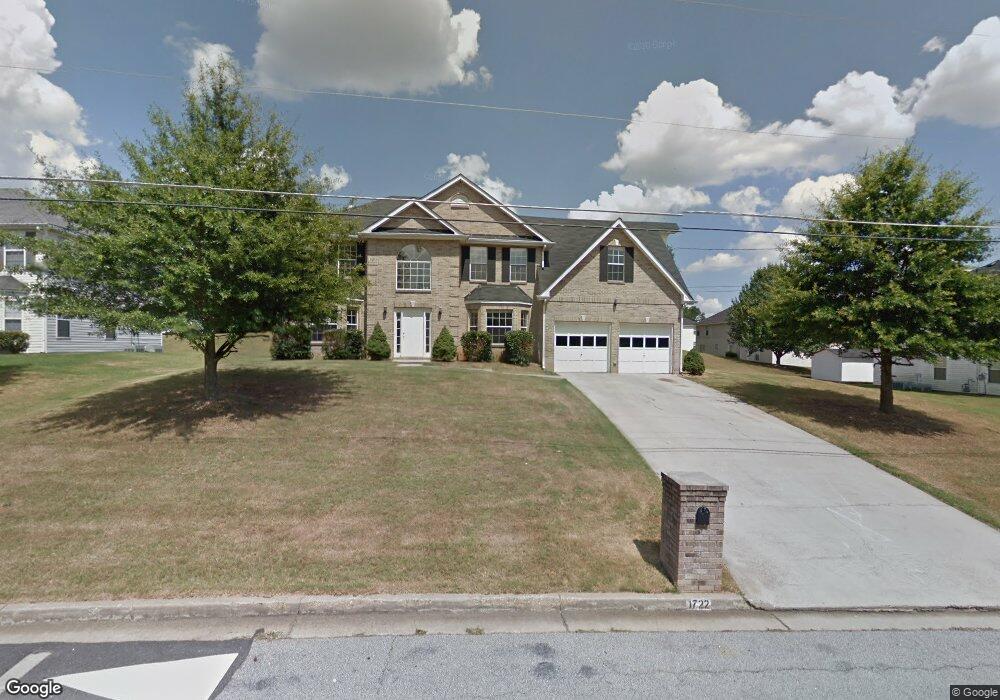
1722 Duren Fields Way Unit II Lithonia, GA 30058
Estimated Value: $342,528 - $379,000
5
Beds
3
Baths
3,254
Sq Ft
$110/Sq Ft
Est. Value
About This Home
This home is located at 1722 Duren Fields Way Unit II, Lithonia, GA 30058 and is currently estimated at $359,382, approximately $110 per square foot. 1722 Duren Fields Way Unit II is a home located in DeKalb County with nearby schools including Redan Elementary School, Redan Middle School, and Redan High School.
Ownership History
Date
Name
Owned For
Owner Type
Purchase Details
Closed on
Nov 30, 2012
Sold by
Secretary Of Housing And U
Bought by
Simpson Natasha Takia
Current Estimated Value
Home Financials for this Owner
Home Financials are based on the most recent Mortgage that was taken out on this home.
Original Mortgage
$85,877
Outstanding Balance
$62,101
Interest Rate
4.4%
Mortgage Type
FHA
Estimated Equity
$297,281
Purchase Details
Closed on
Dec 13, 2011
Sold by
Wells Fargo Bank Na
Bought by
Housing And Urban Development
Purchase Details
Closed on
Dec 6, 2011
Sold by
Patterson Derrick E
Bought by
Wells Fargo Bank Na
Purchase Details
Closed on
Jul 16, 1999
Sold by
Flat Shoals Development Co
Bought by
Patterson Derrick E
Home Financials for this Owner
Home Financials are based on the most recent Mortgage that was taken out on this home.
Original Mortgage
$160,850
Interest Rate
7.51%
Mortgage Type
FHA
Create a Home Valuation Report for This Property
The Home Valuation Report is an in-depth analysis detailing your home's value as well as a comparison with similar homes in the area
Home Values in the Area
Average Home Value in this Area
Purchase History
| Date | Buyer | Sale Price | Title Company |
|---|---|---|---|
| Simpson Natasha Takia | $90,000 | -- | |
| Housing And Urban Development | -- | -- | |
| Wells Fargo Bank Na | $53,600 | -- | |
| Patterson Derrick E | $161,900 | -- |
Source: Public Records
Mortgage History
| Date | Status | Borrower | Loan Amount |
|---|---|---|---|
| Open | Simpson Natasha Takia | $85,877 | |
| Closed | Simpson Natasha Takia | $45,000 | |
| Previous Owner | Patterson Derrick E | $160,850 |
Source: Public Records
Tax History Compared to Growth
Tax History
| Year | Tax Paid | Tax Assessment Tax Assessment Total Assessment is a certain percentage of the fair market value that is determined by local assessors to be the total taxable value of land and additions on the property. | Land | Improvement |
|---|---|---|---|---|
| 2025 | $4,211 | $134,760 | $14,000 | $120,760 |
| 2024 | $4,321 | $132,280 | $14,000 | $118,280 |
| 2023 | $4,321 | $112,000 | $14,000 | $98,000 |
| 2022 | $5,235 | $110,680 | $14,000 | $96,680 |
| 2021 | $3,869 | $79,560 | $10,000 | $69,560 |
| 2020 | $3,111 | $62,280 | $10,000 | $52,280 |
| 2019 | $3,585 | $73,080 | $10,000 | $63,080 |
| 2018 | $2,745 | $58,280 | $4,720 | $53,560 |
| 2017 | $2,930 | $57,880 | $4,720 | $53,160 |
| 2016 | $2,732 | $53,280 | $4,720 | $48,560 |
| 2014 | $2,321 | $42,920 | $4,720 | $38,200 |
Source: Public Records
Map
Nearby Homes
- 1667 Wellborn Rd
- 5919 Duren Farms Cir
- 5934 S Deshon Ct
- 5928 S Deshon Ct
- 6024 S Deshon Ct
- 5969 Bretton Woods Dr
- 5925 Bretton Woods Dr
- 5940 Fairfield Estates Dr
- 1760 Waterton Ln
- 6060 Waterton Dr
- 5827 Christopher Ln
- 6102 Waterton Dr
- 5964 Giles Rd
- 6124 Waterton Dr Unit 1
- 5972 Giles Rd
- 6232 Springwater Ln Unit 1
- 5822 Giles Rd
- 1516 Young Rd
- 5789 Dorian Ct
- 5851 Giles Rd
- 1714 Duren Fields Way
- 1730 Duren Fields Way
- 5984 Duren Meadows Dr
- 1723 Duren Fields Way Unit 2
- 1706 Duren Fields Way
- 5943 Duren Fields Place
- 5943 Duren Fields Place Unit II
- 1731 Duren Fields Way
- 1681 Wellborn Rd
- 5994 Duren Meadows Dr Unit 2
- 5935 Duren Fields Place
- 1696 Duren Fields Way
- 5942 Duren Fields Place Unit 2
- 5952 Duren Meadows Dr Unit 2
- 5977 Duren Meadows Dr
- 5969 Duren Meadows Dr Unit 2
- 5985 Duren Meadows Dr
- 6004 Duren Meadows Dr
- 5961 Duren Meadows Dr
- 5934 Duren Fields Place