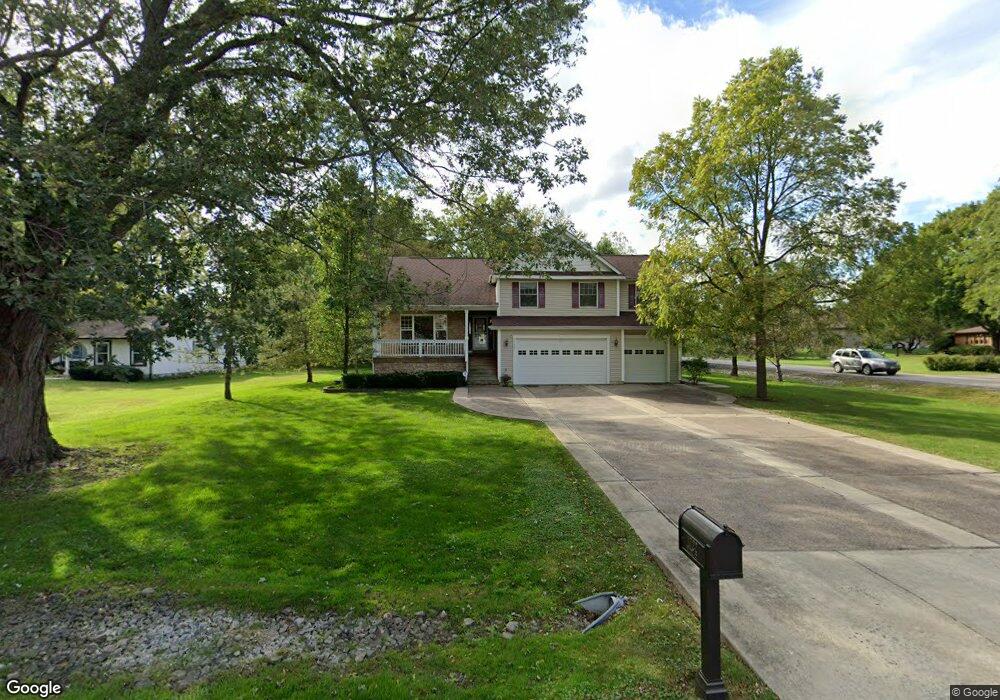
1722 Hazel Ct Unit 7 Sleepy Hollow, IL 60118
Estimated Value: $438,000 - $518,263
4
Beds
3
Baths
2,800
Sq Ft
$176/Sq Ft
Est. Value
About This Home
This home is located at 1722 Hazel Ct Unit 7, Sleepy Hollow, IL 60118 and is currently estimated at $494,066, approximately $176 per square foot. 1722 Hazel Ct Unit 7 is a home located in Kane County with nearby schools including Sleepy Hollow Elementary School, Dundee Middle School, and West Prairie Middle School.
Ownership History
Date
Name
Owned For
Owner Type
Purchase Details
Closed on
Aug 18, 2011
Sold by
Gerhardt William S
Bought by
Reiner Robert and Reiner Gretchen J
Current Estimated Value
Home Financials for this Owner
Home Financials are based on the most recent Mortgage that was taken out on this home.
Original Mortgage
$266,800
Outstanding Balance
$184,557
Interest Rate
4.55%
Mortgage Type
New Conventional
Estimated Equity
$309,509
Purchase Details
Closed on
May 29, 2003
Sold by
Larsen Rene and Larsen Judith
Bought by
Gerhardt William S
Home Financials for this Owner
Home Financials are based on the most recent Mortgage that was taken out on this home.
Original Mortgage
$273,000
Interest Rate
4%
Mortgage Type
Purchase Money Mortgage
Purchase Details
Closed on
May 17, 2002
Sold by
Lupella James
Bought by
Larsen Rene and Larsen Judith
Purchase Details
Closed on
May 15, 2002
Sold by
Lasalle Bank National Assn
Bought by
Lupella James
Create a Home Valuation Report for This Property
The Home Valuation Report is an in-depth analysis detailing your home's value as well as a comparison with similar homes in the area
Home Values in the Area
Average Home Value in this Area
Purchase History
| Date | Buyer | Sale Price | Title Company |
|---|---|---|---|
| Reiner Robert | $333,500 | None Available | |
| Gerhardt William S | $351,000 | -- | |
| Larsen Rene | $50,000 | -- | |
| Lupella James | $41,500 | -- |
Source: Public Records
Mortgage History
| Date | Status | Borrower | Loan Amount |
|---|---|---|---|
| Open | Reiner Robert | $266,800 | |
| Previous Owner | Gerhardt William S | $273,000 |
Source: Public Records
Tax History Compared to Growth
Tax History
| Year | Tax Paid | Tax Assessment Tax Assessment Total Assessment is a certain percentage of the fair market value that is determined by local assessors to be the total taxable value of land and additions on the property. | Land | Improvement |
|---|---|---|---|---|
| 2024 | $10,165 | $143,484 | $30,682 | $112,802 |
| 2023 | $9,715 | $129,102 | $27,607 | $101,495 |
| 2022 | $10,084 | $128,960 | $27,607 | $101,353 |
| 2021 | $9,777 | $121,763 | $26,066 | $95,697 |
| 2020 | $9,462 | $119,025 | $25,480 | $93,545 |
| 2019 | $9,203 | $112,991 | $24,188 | $88,803 |
| 2018 | $10,078 | $119,098 | $23,709 | $95,389 |
| 2017 | $9,685 | $111,411 | $22,179 | $89,232 |
| 2016 | $9,662 | $103,834 | $22,569 | $81,265 |
| 2015 | -- | $97,296 | $21,148 | $76,148 |
| 2014 | -- | $94,609 | $20,564 | $74,045 |
| 2013 | -- | $97,504 | $21,193 | $76,311 |
Source: Public Records
Map
Nearby Homes
- 104 Thorobred Ln
- 842 Winmoor Dr
- 1715 W Main St
- 215 Sharon Dr
- 325 Sharon Dr
- 812 Lindsay Ln
- 822 Lindsay Ln
- 814 Lindsay Ln
- 816 Lindsay Ln
- 813 Lindsay Ln
- 825 Lindsay Ln
- 818 Lindsay Ln
- 849 Hemlock Dr
- Marianne Plan at Hickory Glen
- Charlotte Plan at Hickory Glen
- 1023 Shagbark Ln
- 1031 Shagbark Ln
- 1042 Chateau Bluff Ln
- 1601 Higgins Rd
- 936 Glen Oak Dr
- 1724 Hazel Ct Unit 7
- 720 Hillcrest Dr
- 717 Hillcrest Dr
- 1733 Hazel Ct
- 1726 Hazel Ct
- 722 Hillcrest Dr Unit 7
- 718 Hillcrest Dr Unit 7
- 1731 Hazel Ct
- 716 Hillcrest Dr
- 1727 Hazel Ct
- 1717 Myrna Ct Unit COT
- 1729 Hazel Ct Unit 7
- 724 Hillcrest Dr Unit 7
- 1517 Laurel Ct
- 714 Hillcrest Dr
- 735 Hillcrest Dr
- 1515 Laurel Ct
- 1716 Myrna Ct
- LOT 5 Hillcrest Dr
- 726 Hillcrest Dr