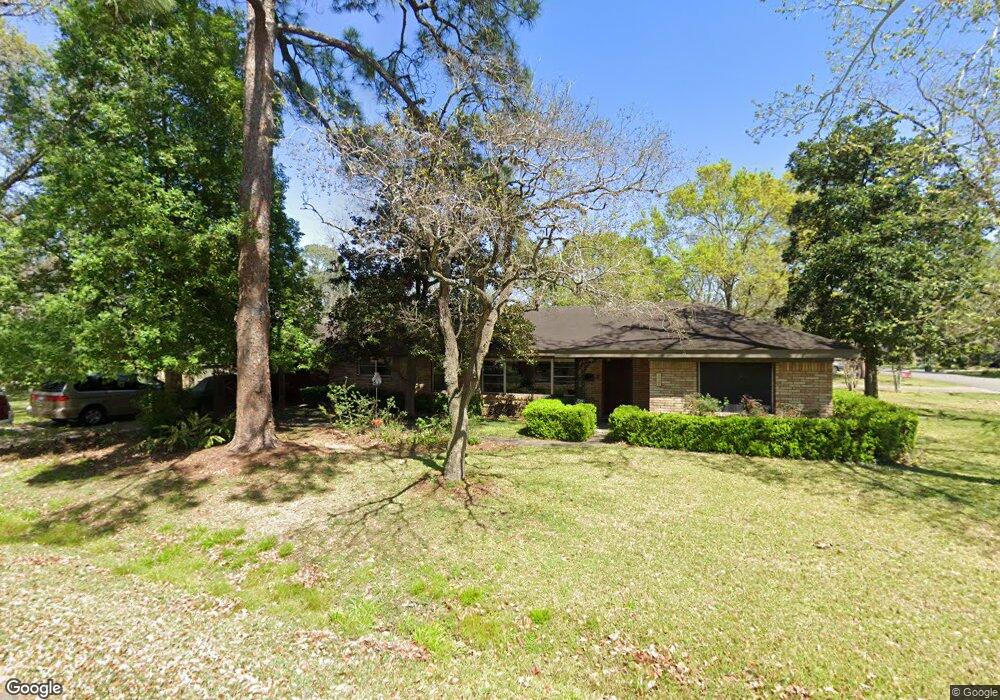
1722 Hollister St Houston, TX 77055
Spring Branch Central NeighborhoodEstimated Value: $666,626 - $813,000
3
Beds
2
Baths
1,798
Sq Ft
$412/Sq Ft
Est. Value
About This Home
This home is located at 1722 Hollister St, Houston, TX 77055 and is currently estimated at $741,407, approximately $412 per square foot. 1722 Hollister St is a home located in Harris County with nearby schools including Valley Oaks Elementary School, Spring Branch Middle School, and Memorial High School.
Ownership History
Date
Name
Owned For
Owner Type
Purchase Details
Closed on
May 13, 2009
Sold by
Hirvonen Mikael A and Hirvonen Joy A
Bought by
Cheah Chor Yee and Yoshihashi Chie
Current Estimated Value
Home Financials for this Owner
Home Financials are based on the most recent Mortgage that was taken out on this home.
Original Mortgage
$209,600
Outstanding Balance
$131,787
Interest Rate
4.76%
Mortgage Type
Purchase Money Mortgage
Estimated Equity
$609,620
Purchase Details
Closed on
Sep 25, 2008
Sold by
Owings Richard Charles
Bought by
Hirvonen Mikael A and Hirvonen Joy A
Home Financials for this Owner
Home Financials are based on the most recent Mortgage that was taken out on this home.
Original Mortgage
$254,852
Interest Rate
6.52%
Mortgage Type
Purchase Money Mortgage
Purchase Details
Closed on
Dec 22, 2000
Sold by
Owings Jack M
Bought by
Owings Richard Charles
Create a Home Valuation Report for This Property
The Home Valuation Report is an in-depth analysis detailing your home's value as well as a comparison with similar homes in the area
Home Values in the Area
Average Home Value in this Area
Purchase History
| Date | Buyer | Sale Price | Title Company |
|---|---|---|---|
| Cheah Chor Yee | -- | Commonwealth Title | |
| Hirvonen Mikael A | -- | Commonwealth Title | |
| Owings Richard Charles | -- | -- | |
| Owings Richard Charles | -- | -- |
Source: Public Records
Mortgage History
| Date | Status | Borrower | Loan Amount |
|---|---|---|---|
| Open | Cheah Chor Yee | $209,600 | |
| Previous Owner | Hirvonen Mikael A | $254,852 |
Source: Public Records
Tax History Compared to Growth
Tax History
| Year | Tax Paid | Tax Assessment Tax Assessment Total Assessment is a certain percentage of the fair market value that is determined by local assessors to be the total taxable value of land and additions on the property. | Land | Improvement |
|---|---|---|---|---|
| 2025 | $7,854 | $574,937 | $528,000 | $46,937 |
| 2024 | $7,854 | $506,425 | $440,000 | $66,425 |
| 2023 | $7,854 | $489,444 | $440,000 | $49,444 |
| 2022 | $11,702 | $479,998 | $385,000 | $94,998 |
| 2021 | $11,619 | $475,882 | $385,000 | $90,882 |
| 2020 | $12,187 | $467,726 | $385,000 | $82,726 |
| 2019 | $11,650 | $452,000 | $385,000 | $67,000 |
| 2018 | $3,814 | $389,651 | $385,000 | $4,651 |
| 2017 | $9,396 | $462,383 | $385,000 | $77,383 |
| 2016 | $8,542 | $462,383 | $385,000 | $77,383 |
| 2015 | $5,536 | $397,677 | $385,000 | $12,677 |
| 2014 | $5,536 | $269,840 | $187,000 | $82,840 |
Source: Public Records
Map
Nearby Homes
- 8935 Pado St
- 1715 Bologna Ln
- 1709 Bologna Ln
- 1707 Bologna Ln
- 1711 Bologna Ln
- 1705 Bologna Ln
- 8706 Ojeman Creek Ln
- 1747 Ojeman Spring Ln
- 8702 Ojeman Villas Dr
- 1720 Sedola Ln
- 1704 Sedola Ln
- 8911 Grovner Place
- 8913 Grovner Place
- 8915 Grovner Place
- 8919 Grovner Place
- 8925 Grovner Place
- 8927 Grovner Place
- 8929 Grovner Place
- 1745 Plan at Regents Court
- 2185 Plan at Regents Court
- 8750 Turriff St
- 1726 Hollister St
- 8746 Turriff St
- 1730 Hollister St
- 1721 Hollister St
- 1716 Hollister St
- 1717 Hollister St
- 1725 Hollister St
- 8749 Turriff St
- 1713 Hollister St
- 8742 Turriff St
- 1729 Hollister St
- 1733 Longacre Dr
- 1733 Longacre Dr Unit lt11b4
- 8745 Turriff St
- 1729 Longacre Dr
- 1709 Hollister St
- 1733 Hollister St
- 1718 Cranway Dr
- 1737 Longacre Dr