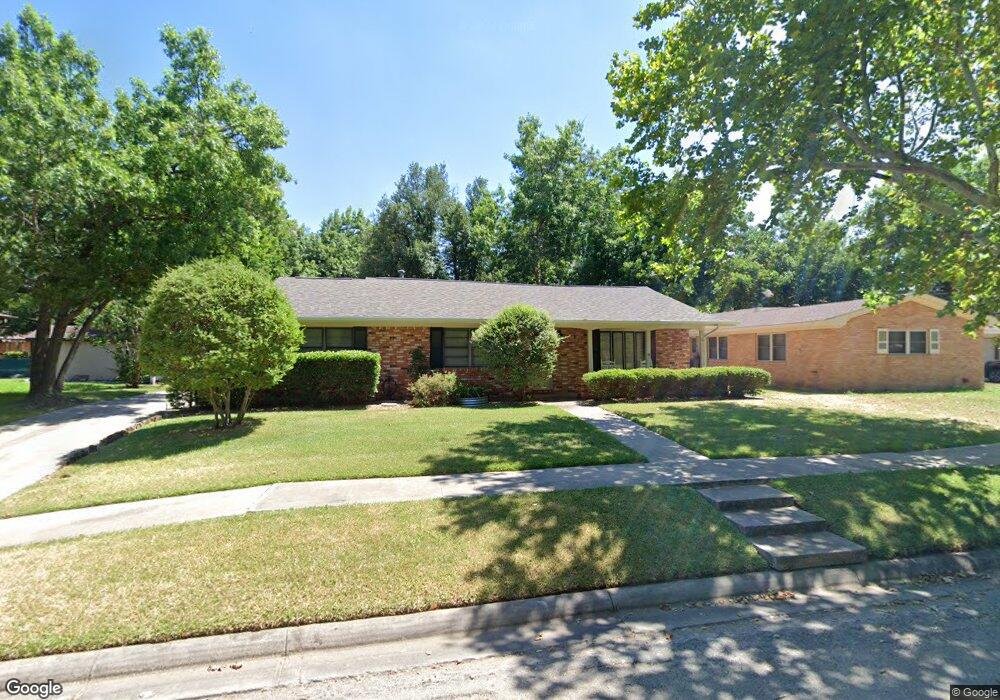
1722 Laurel Rd Gainesville, TX 76240
Estimated Value: $278,000 - $307,000
3
Beds
2
Baths
1,998
Sq Ft
$145/Sq Ft
Est. Value
About This Home
This home is located at 1722 Laurel Rd, Gainesville, TX 76240 and is currently estimated at $289,996, approximately $145 per square foot. 1722 Laurel Rd is a home located in Cooke County with nearby schools including Edison Elementary School, W.E. Chalmers Elementary School, and Gainesville Jr. High School.
Ownership History
Date
Name
Owned For
Owner Type
Purchase Details
Closed on
May 28, 2014
Sold by
Edwards James G
Bought by
Gilbreath George Jordan and Byerly Darla M
Current Estimated Value
Home Financials for this Owner
Home Financials are based on the most recent Mortgage that was taken out on this home.
Original Mortgage
$134,900
Outstanding Balance
$102,472
Interest Rate
4.32%
Mortgage Type
New Conventional
Estimated Equity
$187,524
Purchase Details
Closed on
Oct 5, 2012
Sold by
Davis Scott
Bought by
Edwards James G
Home Financials for this Owner
Home Financials are based on the most recent Mortgage that was taken out on this home.
Original Mortgage
$127,645
Interest Rate
3.75%
Mortgage Type
FHA
Purchase Details
Closed on
Oct 19, 2005
Sold by
Davis Mary M
Bought by
Davis Scott
Create a Home Valuation Report for This Property
The Home Valuation Report is an in-depth analysis detailing your home's value as well as a comparison with similar homes in the area
Purchase History
| Date | Buyer | Sale Price | Title Company |
|---|---|---|---|
| Gilbreath George Jordan | -- | None Available | |
| Edwards James G | -- | None Available | |
| Davis Scott | -- | -- |
Source: Public Records
Mortgage History
| Date | Status | Borrower | Loan Amount |
|---|---|---|---|
| Open | Gilbreath George Jordan | $134,900 | |
| Previous Owner | Edwards James G | $127,645 |
Source: Public Records
Tax History
| Year | Tax Paid | Tax Assessment Tax Assessment Total Assessment is a certain percentage of the fair market value that is determined by local assessors to be the total taxable value of land and additions on the property. | Land | Improvement |
|---|---|---|---|---|
| 2025 | $4,364 | $303,143 | $57,437 | $258,299 |
| 2024 | $4,915 | $275,585 | $57,406 | $258,299 |
| 2023 | $4,915 | $250,532 | $52,285 | $234,621 |
| 2022 | $4,958 | $302,427 | $43,472 | $258,955 |
| 2021 | $5,332 | $227,265 | $29,060 | $198,205 |
| 2020 | $4,999 | $195,167 | $29,060 | $166,107 |
| 2019 | $4,676 | $180,109 | $29,060 | $151,049 |
| 2018 | $4,245 | $155,560 | $14,530 | $141,030 |
| 2017 | $4,050 | $148,985 | $14,530 | $134,455 |
| 2015 | $3,149 | $141,214 | $14,530 | $126,684 |
| 2014 | $3,149 | $125,572 | $14,530 | $111,042 |
Source: Public Records
Map
Nearby Homes
- 1706 E Garnett St
- 1722 Morningside Dr
- 506 Meadow Dr
- 405 Meadow Dr
- 1704 Harris St
- 1905 Bridle Ln
- 1907 Bridle Ln
- 1522 Harris St
- 1520 Harris St
- 1404 E Tennie St
- 1815 Bersand
- 1800 Silver Oaks Dr
- 1734 E California St
- 1103 Vintage Ave
- 1822 Vallana Dr
- 1815 Vallana Dr
- 1108 Locust St
- 1601 Cherry St
- 2150 Harris St
- 701 S Clements St
Your Personal Tour Guide
Ask me questions while you tour the home.