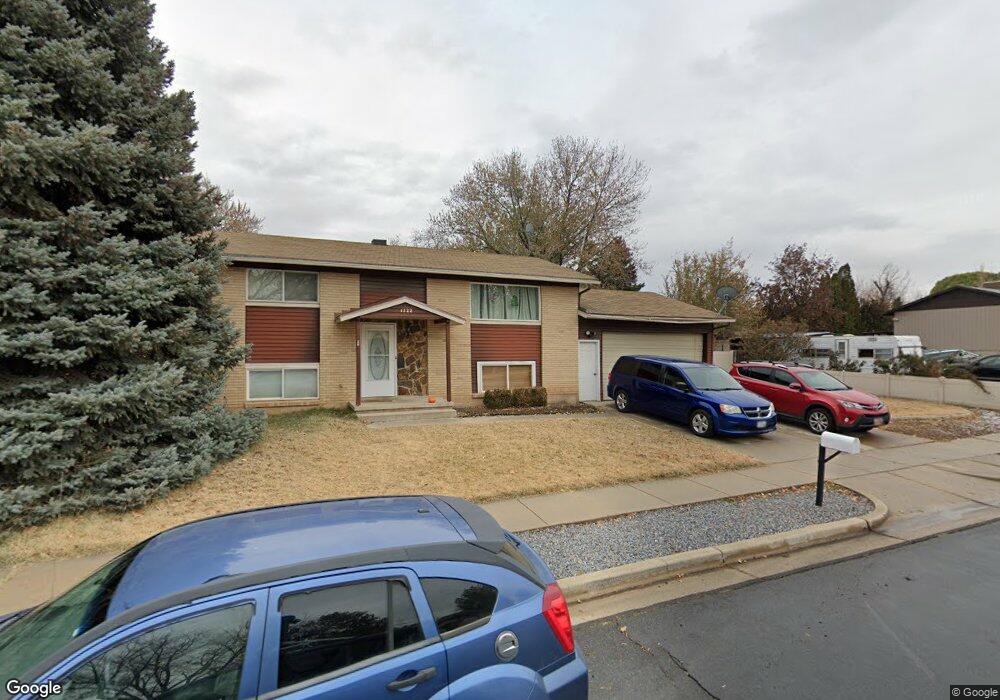
1722 N 670 W Clearfield, UT 84015
Estimated Value: $411,000 - $450,000
4
Beds
2
Baths
1,764
Sq Ft
$242/Sq Ft
Est. Value
About This Home
This home is located at 1722 N 670 W, Clearfield, UT 84015 and is currently estimated at $426,065, approximately $241 per square foot. 1722 N 670 W is a home located in Davis County with nearby schools including Sunset School, Sunset Junior High School, and Clearfield High School.
Ownership History
Date
Name
Owned For
Owner Type
Purchase Details
Closed on
Apr 6, 2018
Sold by
Burr Derek
Bought by
Burr Brent G
Current Estimated Value
Home Financials for this Owner
Home Financials are based on the most recent Mortgage that was taken out on this home.
Original Mortgage
$176,250
Outstanding Balance
$151,104
Interest Rate
4.4%
Mortgage Type
New Conventional
Estimated Equity
$274,961
Purchase Details
Closed on
Sep 22, 2011
Sold by
Nebeker Matthew L and Nebeker Summer
Bought by
Burr Derek
Home Financials for this Owner
Home Financials are based on the most recent Mortgage that was taken out on this home.
Original Mortgage
$150,000
Interest Rate
4.26%
Mortgage Type
New Conventional
Purchase Details
Closed on
Jan 30, 2009
Sold by
Nebeker Mathew L and Nebeker Summer
Bought by
Nebeker Matthew L and Nebeker Summer
Home Financials for this Owner
Home Financials are based on the most recent Mortgage that was taken out on this home.
Original Mortgage
$118,000
Interest Rate
5.04%
Mortgage Type
New Conventional
Purchase Details
Closed on
May 2, 2006
Sold by
Phillips Charese N
Bought by
Nebeker Matthew L and Nebeker Summer
Home Financials for this Owner
Home Financials are based on the most recent Mortgage that was taken out on this home.
Original Mortgage
$13,300
Interest Rate
6.29%
Mortgage Type
Stand Alone Second
Purchase Details
Closed on
Oct 10, 1997
Sold by
Phillips Charese N
Bought by
Phillips Charese N and Nebeker Dixie A
Home Financials for this Owner
Home Financials are based on the most recent Mortgage that was taken out on this home.
Original Mortgage
$82,000
Interest Rate
7.04%
Purchase Details
Closed on
Apr 25, 1996
Sold by
Nebeker Lee D and Nebeker Dixie A
Bought by
Phillips Charese N and Nebeker Dixie A
Home Financials for this Owner
Home Financials are based on the most recent Mortgage that was taken out on this home.
Original Mortgage
$69,680
Interest Rate
7.84%
Create a Home Valuation Report for This Property
The Home Valuation Report is an in-depth analysis detailing your home's value as well as a comparison with similar homes in the area
Home Values in the Area
Average Home Value in this Area
Purchase History
| Date | Buyer | Sale Price | Title Company |
|---|---|---|---|
| Burr Brent G | -- | Security Title | |
| Burr Derek | -- | American Preferred | |
| Nebeker Matthew L | -- | Mountain View Title | |
| Nebeker Matthew L | -- | Hickman Land Title Co | |
| Phillips Charese N | -- | Inwest Title Services Inc | |
| Phillips Charese N | -- | Inwest Title Services Inc | |
| Phillips Charese N | -- | Home Abst & Title Co |
Source: Public Records
Mortgage History
| Date | Status | Borrower | Loan Amount |
|---|---|---|---|
| Open | Burr Brent G | $176,250 | |
| Closed | Burr Derek | $150,000 | |
| Previous Owner | Nebeker Matthew L | $118,000 | |
| Previous Owner | Nebeker Matthew L | $13,300 | |
| Previous Owner | Nebeker Matthew L | $106,480 | |
| Previous Owner | Phillips Charese N | $82,000 | |
| Previous Owner | Phillips Charese N | $69,680 |
Source: Public Records
Tax History Compared to Growth
Tax History
| Year | Tax Paid | Tax Assessment Tax Assessment Total Assessment is a certain percentage of the fair market value that is determined by local assessors to be the total taxable value of land and additions on the property. | Land | Improvement |
|---|---|---|---|---|
| 2025 | $2,288 | $220,001 | $83,496 | $136,505 |
| 2024 | $2,231 | $215,599 | $92,017 | $123,582 |
| 2023 | $2,030 | $199,650 | $57,351 | $142,298 |
| 2022 | $2,163 | $389,000 | $116,906 | $272,094 |
| 2021 | $2,003 | $294,000 | $79,627 | $214,373 |
| 2020 | $1,728 | $251,000 | $67,204 | $183,796 |
| 2019 | $1,663 | $236,000 | $79,380 | $156,620 |
| 2018 | $1,535 | $214,000 | $67,159 | $146,841 |
| 2016 | $1,284 | $92,455 | $26,056 | $66,399 |
| 2015 | $1,222 | $83,655 | $26,056 | $57,599 |
| 2014 | $1,100 | $76,465 | $26,056 | $50,409 |
| 2013 | -- | $77,190 | $25,230 | $51,960 |
Source: Public Records
Map
Nearby Homes