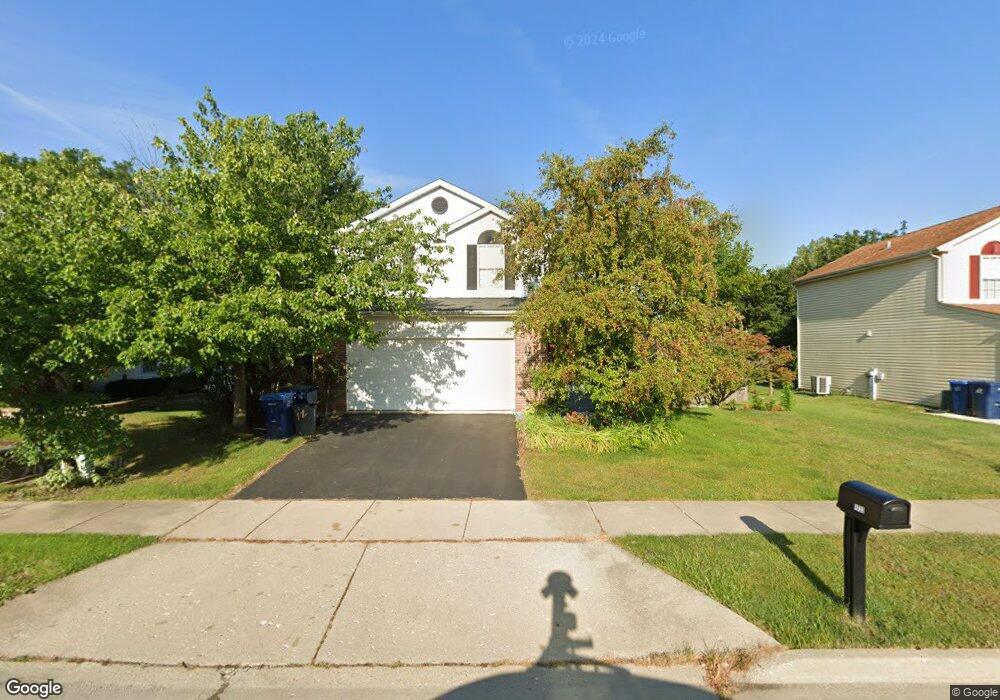
1722 N Baldwin Ave Waukegan, IL 60085
Estimated Value: $285,000 - $334,000
3
Beds
3
Baths
1,516
Sq Ft
$204/Sq Ft
Est. Value
About This Home
This home is located at 1722 N Baldwin Ave, Waukegan, IL 60085 and is currently estimated at $309,408, approximately $204 per square foot. 1722 N Baldwin Ave is a home located in Lake County with nearby schools including Clearview Elementary School, Miguel Juarez Middle School, and Waukegan High School.
Ownership History
Date
Name
Owned For
Owner Type
Purchase Details
Closed on
May 17, 2005
Sold by
Rodriguez Jose
Bought by
Rodriguez Jose and Rodriguez Maria G
Current Estimated Value
Home Financials for this Owner
Home Financials are based on the most recent Mortgage that was taken out on this home.
Original Mortgage
$160,800
Outstanding Balance
$85,497
Interest Rate
6.25%
Mortgage Type
Fannie Mae Freddie Mac
Estimated Equity
$223,911
Purchase Details
Closed on
Mar 31, 2005
Sold by
Wagner Debra D
Bought by
Rodriguez Jose
Home Financials for this Owner
Home Financials are based on the most recent Mortgage that was taken out on this home.
Original Mortgage
$160,800
Outstanding Balance
$85,497
Interest Rate
6.25%
Mortgage Type
Fannie Mae Freddie Mac
Estimated Equity
$223,911
Purchase Details
Closed on
Sep 10, 1996
Sold by
Parkway Bank & Trust Company
Bought by
Wagner William R and Wagner Debra D
Home Financials for this Owner
Home Financials are based on the most recent Mortgage that was taken out on this home.
Original Mortgage
$138,344
Interest Rate
8.14%
Mortgage Type
FHA
Create a Home Valuation Report for This Property
The Home Valuation Report is an in-depth analysis detailing your home's value as well as a comparison with similar homes in the area
Home Values in the Area
Average Home Value in this Area
Purchase History
| Date | Buyer | Sale Price | Title Company |
|---|---|---|---|
| Rodriguez Jose | -- | -- | |
| Rodriguez Jose | $203,666 | Ticor | |
| Wagner William R | $143,000 | -- |
Source: Public Records
Mortgage History
| Date | Status | Borrower | Loan Amount |
|---|---|---|---|
| Open | Rodriguez Jose | $160,800 | |
| Previous Owner | Wagner William R | $138,344 | |
| Closed | Rodriguez Jose | $40,200 |
Source: Public Records
Tax History Compared to Growth
Tax History
| Year | Tax Paid | Tax Assessment Tax Assessment Total Assessment is a certain percentage of the fair market value that is determined by local assessors to be the total taxable value of land and additions on the property. | Land | Improvement |
|---|---|---|---|---|
| 2024 | $6,418 | $86,598 | $13,623 | $72,975 |
| 2023 | $6,310 | $76,066 | $11,979 | $64,087 |
| 2022 | $6,310 | $70,544 | $11,166 | $59,378 |
| 2021 | $5,952 | $63,093 | $9,959 | $53,134 |
| 2020 | $5,983 | $58,779 | $9,278 | $49,501 |
| 2019 | $5,969 | $53,862 | $8,502 | $45,360 |
| 2018 | $6,492 | $56,595 | $12,404 | $44,191 |
| 2017 | $6,269 | $50,071 | $10,974 | $39,097 |
| 2016 | $5,130 | $39,198 | $8,591 | $30,607 |
| 2015 | $4,913 | $35,083 | $7,689 | $27,394 |
| 2014 | $5,786 | $39,734 | $8,741 | $30,993 |
| 2012 | $5,724 | $43,049 | $9,471 | $33,578 |
Source: Public Records
Map
Nearby Homes
- 2810 W Atlantic Ave
- 2715 W Greenwood Ave
- 2813 Theresa Ave
- 2928 W Country Club Ave
- 3000 W Country Club Ave
- 2946 W Country Club Ave
- 2440 W Cheyenne Rd
- 1913 Chippewa Rd
- 12352 W Atlantic Ave
- 2207 Williamsburg Dr
- 3320 Sunset Ave
- 1430 N Green Bay Rd
- 2008 Harding Ave
- 2009 Harding Ave
- 12933 W Polo Ave
- 35400 N Green Bay Rd
- 2713 Varonen Ave
- 3409 Glen Flora Ave
- 3436 Florida Ave
- 12698 W Grandview Ave
- 1716 N Baldwin Ave
- 1728 N Baldwin Ave
- 1710 N Baldwin Ave
- 1725 N Baldwin Ave
- 1719 N Baldwin Ave
- 1731 N Baldwin Ave
- 1713 N Baldwin Ave
- 1704 N Baldwin Ave
- 1737 N Baldwin Ave
- 1715 N Frolic Ave
- 1711 N Frolic Ave
- 1707 N Baldwin Ave
- 1717 N Frolic Ave
- 1709 N Frolic Ave
- 1709 N Frolic Ave Unit 1709
- 1720 N Metropolitan Ave
- 1743 N Baldwin Ave
- 1714 N Metropolitan Ave
- 1721 N Frolic Ave
- 1726 N Metropolitan Ave