Estimated Value: $198,000 - $201,000
3
Beds
2
Baths
972
Sq Ft
$205/Sq Ft
Est. Value
About This Home
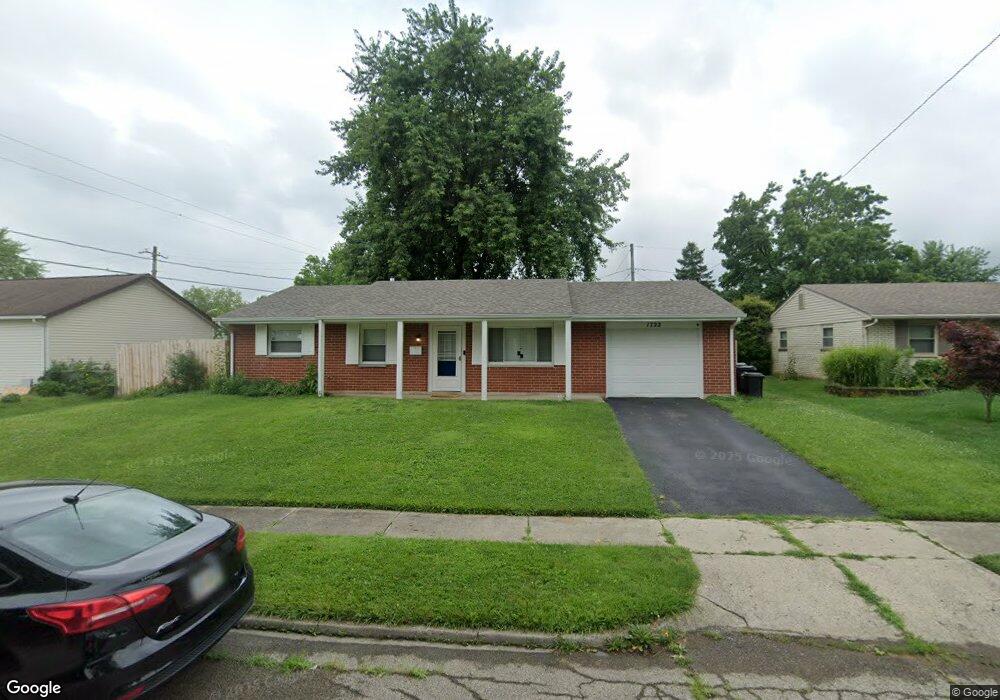
This home is located at 1722 Navajo Dr, Xenia, OH 45385 and is currently estimated at $198,862, approximately $204 per square foot. 1722 Navajo Dr is a home located in Greene County with nearby schools including Xenia High School, Summit Academy Community School for Alternative Learners - Xenia, and Legacy Christian Academy.
Ownership History
Date
Name
Owned For
Owner Type
Purchase Details
Closed on
Jan 11, 2021
Sold by
Hubbs Donna G
Bought by
Hammonds Kyla N and Rowe Tanner D
Current Estimated Value
Home Financials for this Owner
Home Financials are based on the most recent Mortgage that was taken out on this home.
Original Mortgage
$128,135
Outstanding Balance
$115,663
Interest Rate
2.71%
Mortgage Type
FHA
Estimated Equity
$83,199
Purchase Details
Closed on
Mar 13, 2020
Sold by
Beam John A and Beam Linda L
Bought by
Hubbs Billy N and Hubbs Donna G
Purchase Details
Closed on
Mar 19, 1998
Sold by
Eneix Stephen M and Eneix Kimberly S
Bought by
Beam John A and Beam Linda L
Home Financials for this Owner
Home Financials are based on the most recent Mortgage that was taken out on this home.
Original Mortgage
$53,600
Interest Rate
7.15%
Create a Home Valuation Report for This Property
The Home Valuation Report is an in-depth analysis detailing your home's value as well as a comparison with similar homes in the area
Home Values in the Area
Average Home Value in this Area
Purchase History
| Date | Buyer | Sale Price | Title Company |
|---|---|---|---|
| Hammonds Kyla N | $130,500 | None Available | |
| Hubbs Billy N | $110,000 | None Available | |
| Beam John A | $61,000 | -- |
Source: Public Records
Mortgage History
| Date | Status | Borrower | Loan Amount |
|---|---|---|---|
| Open | Hammonds Kyla N | $128,135 | |
| Previous Owner | Beam John A | $53,600 |
Source: Public Records
Tax History Compared to Growth
Tax History
| Year | Tax Paid | Tax Assessment Tax Assessment Total Assessment is a certain percentage of the fair market value that is determined by local assessors to be the total taxable value of land and additions on the property. | Land | Improvement |
|---|---|---|---|---|
| 2024 | $2,339 | $54,660 | $11,800 | $42,860 |
| 2023 | $2,339 | $54,660 | $11,800 | $42,860 |
| 2022 | $1,952 | $38,910 | $6,940 | $31,970 |
| 2021 | $1,978 | $33,010 | $6,940 | $26,070 |
| 2020 | $1,608 | $33,010 | $6,940 | $26,070 |
| 2019 | $1,399 | $27,040 | $6,700 | $20,340 |
| 2018 | $1,405 | $27,040 | $6,700 | $20,340 |
| 2017 | $1,289 | $27,040 | $6,700 | $20,340 |
| 2016 | $1,289 | $24,350 | $6,700 | $17,650 |
| 2015 | $1,293 | $24,350 | $6,700 | $17,650 |
| 2014 | $1,238 | $24,350 | $6,700 | $17,650 |
Source: Public Records
Map
Nearby Homes
- 1618 Navajo Dr
- 1653 Seneca Dr
- 1778 Arapaho Dr
- 1403 Texas Dr
- 1769 Gayhart Dr
- 1829 Gayhart Dr
- 1568 Cheyenne Dr
- 1866 Roxbury Dr
- 1272 Bellbrook Ave
- 1908 Whitt St
- 1144 Rockwell Dr
- 2758 Wyoming Dr
- 1208 Bellbrook Ave
- 161 Montana Dr
- 2142 Michigan Dr
- 1255 Colorado Dr
- 219 Kansas Dr
- 414 Whisper Ln
- 1107 Arkansas Dr
- 2257 Maryland Dr