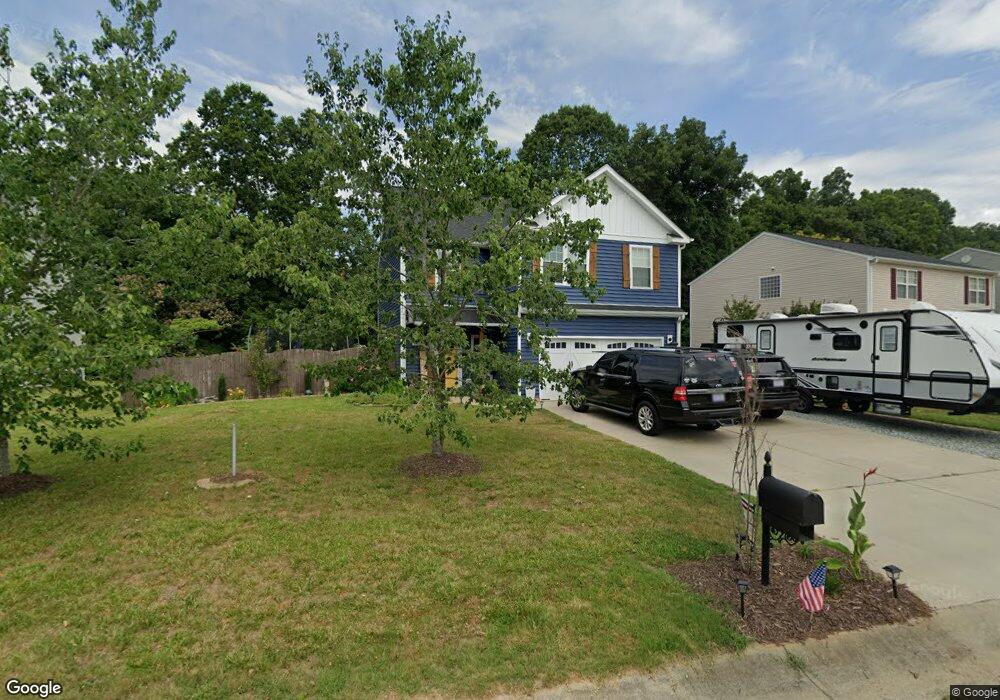
1722 Vanderbilt Ct Graham, NC 27253
South Burlington NeighborhoodEstimated Value: $315,955 - $340,000
4
Beds
3
Baths
2,120
Sq Ft
$153/Sq Ft
Est. Value
About This Home
This home is located at 1722 Vanderbilt Ct, Graham, NC 27253 and is currently estimated at $324,239, approximately $152 per square foot. 1722 Vanderbilt Ct is a home located in Alamance County with nearby schools including South Graham Elementary School, Southern Alamance Middle School, and Southern Alamance High School.
Ownership History
Date
Name
Owned For
Owner Type
Purchase Details
Closed on
Nov 18, 2008
Sold by
Reo Portfolio Svrs Llc
Bought by
Fitzpatrick Charles G
Current Estimated Value
Home Financials for this Owner
Home Financials are based on the most recent Mortgage that was taken out on this home.
Original Mortgage
$137,344
Outstanding Balance
$89,305
Interest Rate
5.89%
Mortgage Type
FHA
Estimated Equity
$234,934
Purchase Details
Closed on
Jul 18, 2008
Sold by
The Bankof New York
Bought by
Reo Portfolio Svrs Llc
Purchase Details
Closed on
Apr 22, 2008
Sold by
Priority Trustees Service
Bought by
The Bank Of New York
Purchase Details
Closed on
Sep 1, 2004
Sold by
D R Horton Inc
Bought by
Gibson Erik L
Home Financials for this Owner
Home Financials are based on the most recent Mortgage that was taken out on this home.
Original Mortgage
$131,565
Interest Rate
5.92%
Mortgage Type
New Conventional
Create a Home Valuation Report for This Property
The Home Valuation Report is an in-depth analysis detailing your home's value as well as a comparison with similar homes in the area
Home Values in the Area
Average Home Value in this Area
Purchase History
| Date | Buyer | Sale Price | Title Company |
|---|---|---|---|
| Fitzpatrick Charles G | $140,000 | -- | |
| Reo Portfolio Svrs Llc | $114,000 | -- | |
| The Bank Of New York | $133,000 | -- | |
| Gibson Erik L | $139,000 | -- |
Source: Public Records
Mortgage History
| Date | Status | Borrower | Loan Amount |
|---|---|---|---|
| Open | Fitzpatrick Charles G | $137,344 | |
| Previous Owner | Gibson Erik L | $131,565 |
Source: Public Records
Tax History
| Year | Tax Paid | Tax Assessment Tax Assessment Total Assessment is a certain percentage of the fair market value that is determined by local assessors to be the total taxable value of land and additions on the property. | Land | Improvement |
|---|---|---|---|---|
| 2025 | $1,412 | $285,885 | $34,000 | $251,885 |
| 2024 | $1,341 | $285,885 | $34,000 | $251,885 |
| 2023 | $2,604 | $285,885 | $34,000 | $251,885 |
| 2022 | $1,964 | $158,288 | $30,000 | $128,288 |
| 2021 | $1,980 | $158,288 | $30,000 | $128,288 |
| 2020 | $1,996 | $158,288 | $30,000 | $128,288 |
| 2019 | $2,001 | $158,288 | $30,000 | $128,288 |
| 2018 | $941 | $158,288 | $30,000 | $128,288 |
| 2017 | $1,864 | $158,288 | $30,000 | $128,288 |
| 2016 | $1,820 | $156,914 | $30,000 | $126,914 |
| 2015 | $906 | $156,914 | $30,000 | $126,914 |
| 2014 | $831 | $157,652 | $30,000 | $127,652 |
Source: Public Records
Map
Nearby Homes
- 1931 Henry Rd
- 3027 Maple Ave Unit S3
- 175 Moyer Dr
- 0 Lewis Dr
- 162 Canopy Dr
- 168 Canopy Dr
- 174 Canopy Dr
- 180 Canopy Dr
- 186 Canopy Dr
- 200 Canopy Dr
- 204 Canopy Dr
- 208 Canopy Dr
- 212 Canopy Dr
- 216 Canopy Dr
- 751 Kernodle Ln Unit 10
- 751 Kernodle Ln Unit 100
- 751 Kernodle Ln Unit 81
- 751 Kernodle Ln Unit 97
- 751 Kernodle Ln Unit 119
- 751 Kernodle Ln Unit 42
- 1714 Vanderbilt Ct
- 1730 Vanderbilt Ct
- 1706 Vanderbilt Ct
- 1719 Vanderbilt Ct
- 1711 Vanderbilt Ct
- 1736 Vanderbilt Ct
- 1636 Vanderbilt Ct
- 1727 Vanderbilt Ct
- 1742 Vanderbilt Ct
- 1735 Vanderbilt Ct
- 1630 Vanderbilt Ct
- 1517 Brambleton Ct
- 1739 Vanderbilt Ct
- 1625 Vanderbilt Ct
- 1521 Brambleton Ct
- 1624 Vanderbilt Ct
- 1603 Brambleton Ct
- 1619 Vanderbilt Ct
- 1512 Brambleton Ct
- 1504 Bancroft Ct
Your Personal Tour Guide
Ask me questions while you tour the home.