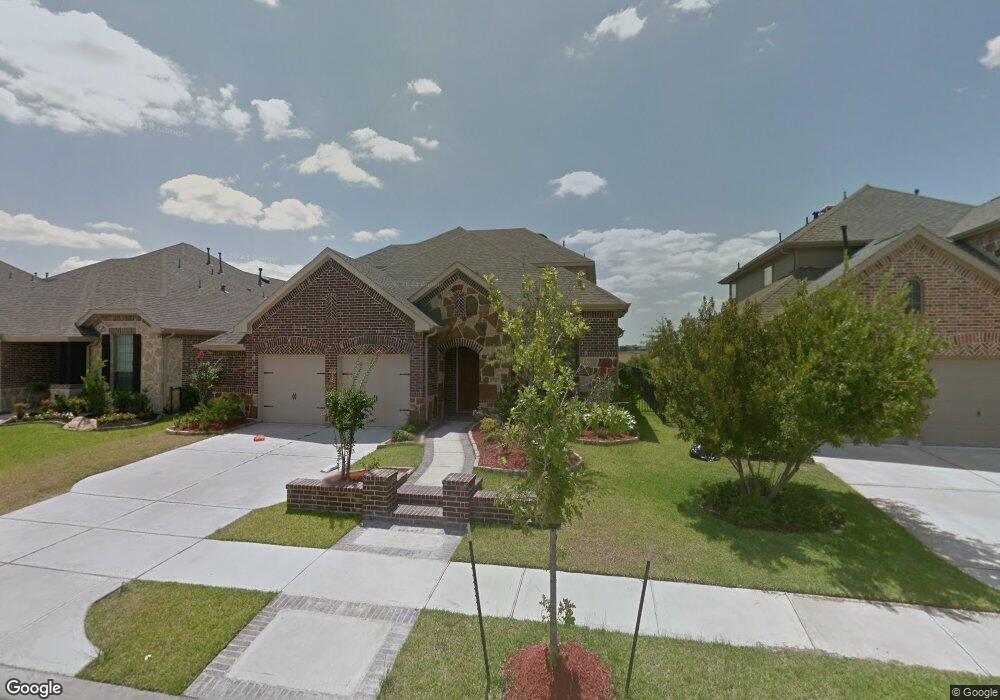
17223 Red Oak Bend Dr Cypress, TX 77433
Bridgeland NeighborhoodEstimated Value: $465,000 - $534,000
4
Beds
3
Baths
2,952
Sq Ft
$174/Sq Ft
Est. Value
About This Home
This home is located at 17223 Red Oak Bend Dr, Cypress, TX 77433 and is currently estimated at $514,907, approximately $174 per square foot. 17223 Red Oak Bend Dr is a home located in Harris County with nearby schools including MCGOWN EL, Bridgeland High School, and Silverline Montessori School - Cypress.
Ownership History
Date
Name
Owned For
Owner Type
Purchase Details
Closed on
Sep 6, 2018
Sold by
Mehta Ashishkumar K and Mehta Kinjal A
Bought by
Liu Zhuo and Hong Ji
Current Estimated Value
Home Financials for this Owner
Home Financials are based on the most recent Mortgage that was taken out on this home.
Original Mortgage
$236,000
Outstanding Balance
$145,323
Interest Rate
4.5%
Mortgage Type
New Conventional
Estimated Equity
$369,584
Purchase Details
Closed on
Jun 19, 2009
Sold by
Highland Homes Houston Ltd
Bought by
Mehta Ashishkumar K and Mehta Kinjal A
Home Financials for this Owner
Home Financials are based on the most recent Mortgage that was taken out on this home.
Original Mortgage
$268,055
Interest Rate
4.83%
Mortgage Type
FHA
Purchase Details
Closed on
Dec 16, 2008
Sold by
Ggp Bridgeland Lp
Bought by
Highland Homes Houston Ltd
Create a Home Valuation Report for This Property
The Home Valuation Report is an in-depth analysis detailing your home's value as well as a comparison with similar homes in the area
Home Values in the Area
Average Home Value in this Area
Purchase History
| Date | Buyer | Sale Price | Title Company |
|---|---|---|---|
| Liu Zhuo | -- | Frontier Title Company Wh Ll | |
| Mehta Ashishkumar K | -- | Old Republic Title Company O | |
| Highland Homes Houston Ltd | -- | None Available |
Source: Public Records
Mortgage History
| Date | Status | Borrower | Loan Amount |
|---|---|---|---|
| Open | Liu Zhuo | $236,000 | |
| Previous Owner | Mehta Ashishkumar K | $268,055 |
Source: Public Records
Tax History Compared to Growth
Tax History
| Year | Tax Paid | Tax Assessment Tax Assessment Total Assessment is a certain percentage of the fair market value that is determined by local assessors to be the total taxable value of land and additions on the property. | Land | Improvement |
|---|---|---|---|---|
| 2025 | $10,709 | $521,340 | $134,888 | $386,452 |
| 2024 | $10,709 | $487,878 | $134,888 | $352,990 |
| 2023 | $10,709 | $513,330 | $134,888 | $378,442 |
| 2022 | $12,378 | $465,314 | $107,723 | $357,591 |
| 2021 | $11,875 | $372,662 | $107,723 | $264,939 |
| 2020 | $11,138 | $314,469 | $82,900 | $231,569 |
| 2019 | $10,688 | $295,000 | $65,570 | $229,430 |
| 2018 | $3,533 | $337,911 | $65,570 | $272,341 |
| 2017 | $12,304 | $337,911 | $65,570 | $272,341 |
| 2016 | $11,933 | $337,911 | $65,570 | $272,341 |
| 2015 | $8,786 | $335,416 | $65,570 | $269,846 |
| 2014 | $8,786 | $272,528 | $43,714 | $228,814 |
Source: Public Records
Map
Nearby Homes
- 18415 Pin Oak Bend Dr
- 18307 Pin Oak Bend Dr
- 17311 Heron Crest Dr
- 17011 Seminole Ridge Dr
- 18330 Chapmans Count Rd
- 17131 Upton Hill Dr
- 18515 Gunda Heights Dr
- 12107 Bayou Junction Rd
- 18426 N Settlers Shore Dr
- 17310 Venado Dr
- 18515 N Settlers Shore Dr
- 18510 N Settlers Shore Dr
- 18210 Hughlett Dr
- 12206 Johns Enterprise Ct
- 18422 Blue Hollow Heights Dr
- 18023 Channel Hill Dr
- 18802 Luby Creek Dr
- 18215 Long Key Dr
- 16831 Amelia Island Dr
- 17507 E Bremonds Bend Ct
- 17227 Red Oak Bend Dr
- 17219 Red Oak Bend Dr
- 17231 Red Oak Bend Dr
- 17215 Red Oak Bend Dr
- 21332 Cypress Red Oak Dr
- 17235 Red Oak Bend Dr
- 17211 Red Oak Bend Dr
- 17222 Red Oak Bend Dr
- 17226 Red Oak Bend Dr
- 17230 Red Oak Bend Dr
- 17239 Red Oak Bend Dr
- 17218 Red Oak Bend Dr
- 18419 W Willow Oak Bend Dr
- 17243 Red Oak Bend Dr
- 18418 Pin Oak Bend Dr
- 17207 Water Oak Bend Ct
- 18414 Pin Oak Bend Dr
- 17211 Water Oak Bend Ct
- 18422 Pin Oak Bend Dr
- 17215 Water Oak Bend Ct