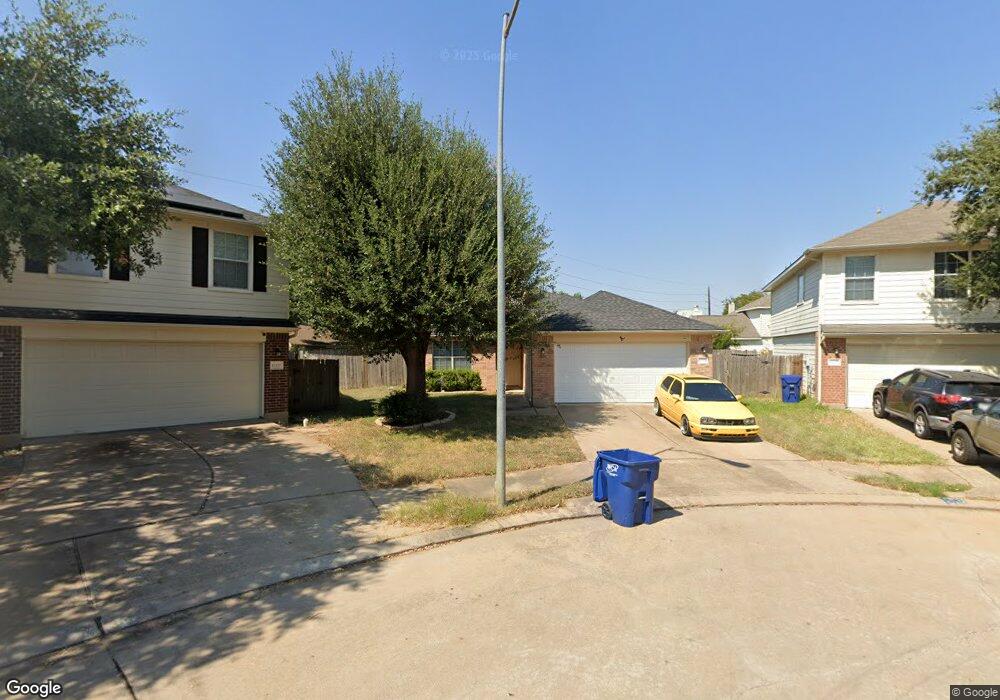
17226 Pleasant Lily Ct Houston, TX 77084
Estimated Value: $217,000 - $245,000
3
Beds
2
Baths
1,197
Sq Ft
$192/Sq Ft
Est. Value
About This Home
This home is located at 17226 Pleasant Lily Ct, Houston, TX 77084 and is currently estimated at $229,704, approximately $191 per square foot. 17226 Pleasant Lily Ct is a home located in Harris County with nearby schools including Metcalf Elementary School, Kahla Middle School, and Langham Creek High School.
Ownership History
Date
Name
Owned For
Owner Type
Purchase Details
Closed on
Jul 12, 2012
Sold by
Federal Home Loan Mortgage Corporation
Bought by
Sanchez Jacqueline and Becerra Elihu
Current Estimated Value
Home Financials for this Owner
Home Financials are based on the most recent Mortgage that was taken out on this home.
Original Mortgage
$99,369
Interest Rate
3.61%
Mortgage Type
FHA
Purchase Details
Closed on
Feb 8, 2012
Sold by
Estrada Beatriz V and Jpmorgan Chase Bank National A
Bought by
Federal Home Loan Mortgage Corporation
Purchase Details
Closed on
Nov 22, 2005
Sold by
Legend Classic Homes Ltd
Bought by
Estrada Beatriz
Home Financials for this Owner
Home Financials are based on the most recent Mortgage that was taken out on this home.
Original Mortgage
$112,000
Interest Rate
6.06%
Mortgage Type
Fannie Mae Freddie Mac
Create a Home Valuation Report for This Property
The Home Valuation Report is an in-depth analysis detailing your home's value as well as a comparison with similar homes in the area
Home Values in the Area
Average Home Value in this Area
Purchase History
| Date | Buyer | Sale Price | Title Company |
|---|---|---|---|
| Sanchez Jacqueline | -- | None Available | |
| Federal Home Loan Mortgage Corporation | $58,500 | None Available | |
| Estrada Beatriz | -- | Stewart Title Houston Div |
Source: Public Records
Mortgage History
| Date | Status | Borrower | Loan Amount |
|---|---|---|---|
| Previous Owner | Sanchez Jacqueline | $99,369 | |
| Previous Owner | Estrada Beatriz | $112,000 |
Source: Public Records
Tax History Compared to Growth
Tax History
| Year | Tax Paid | Tax Assessment Tax Assessment Total Assessment is a certain percentage of the fair market value that is determined by local assessors to be the total taxable value of land and additions on the property. | Land | Improvement |
|---|---|---|---|---|
| 2025 | $3,174 | $180,000 | $54,603 | $125,397 |
| 2024 | $3,174 | $216,600 | $54,603 | $161,997 |
| 2023 | $3,174 | $232,469 | $54,603 | $177,866 |
| 2022 | $4,725 | $196,294 | $41,905 | $154,389 |
| 2021 | $4,492 | $166,009 | $41,905 | $124,104 |
| 2020 | $4,241 | $155,495 | $34,921 | $120,574 |
| 2019 | $3,975 | $144,730 | $22,222 | $122,508 |
| 2018 | $1,073 | $128,258 | $21,753 | $106,505 |
| 2017 | $3,242 | $128,258 | $21,753 | $106,505 |
| 2016 | $2,947 | $120,796 | $21,753 | $99,043 |
| 2015 | $1,837 | $113,137 | $21,753 | $91,384 |
| 2014 | $1,837 | $104,801 | $21,753 | $83,048 |
Source: Public Records
Map
Nearby Homes
- 17219 Glenpatti Dr
- 17311 Northern Star Dr
- 17250 April Valley Ct
- 17414 Davenway Dr
- 17250 Cricketbriar Ct
- 17419 Lobo Trail
- 17325 Fm 529 Rd
- 6839 Catarina Cir
- 17406 Northhagen Dr
- 17602 Kakerglen Ct
- 6718 Bliss Trail
- 6382 Crossway Dr
- 17602 Wild Willow Ln
- 6523 Vanlynn Ln
- 6602 Loch Bruceray Dr
- 17610 Northhagen Dr
- 16842 Anna Green St
- 17015 Sky Blue Place
- 17234 Rush Trace Ct
- 17715 Glenpatti Dr
- 17222 Pleasant Lily Ct
- 17227 Pleasant Lily Ct
- 6622 Loch Langham Dr
- 17227 Blushing Pear Ct
- 6618 Loch Langham Dr
- 6626 Loch Langham Dr
- 17223 Blushing Pear Ct
- 17218 Pleasant Lily Ct
- 6614 Loch Langham Dr
- 17223 Pleasant Lily Ct
- 6630 Loch Langham Dr
- 17214 Pleasant Lily Ct
- 17219 Blushing Pear Ct
- 17219 Pleasant Lily Ct
- 17231 Blushing Pear Ct
- 6610 Loch Langham Dr
- 17215 Pleasant Lily Ct
- 6634 Loch Langham Dr
- 17215 Blushing Pear Ct
- 17210 Pleasant Lily Ct