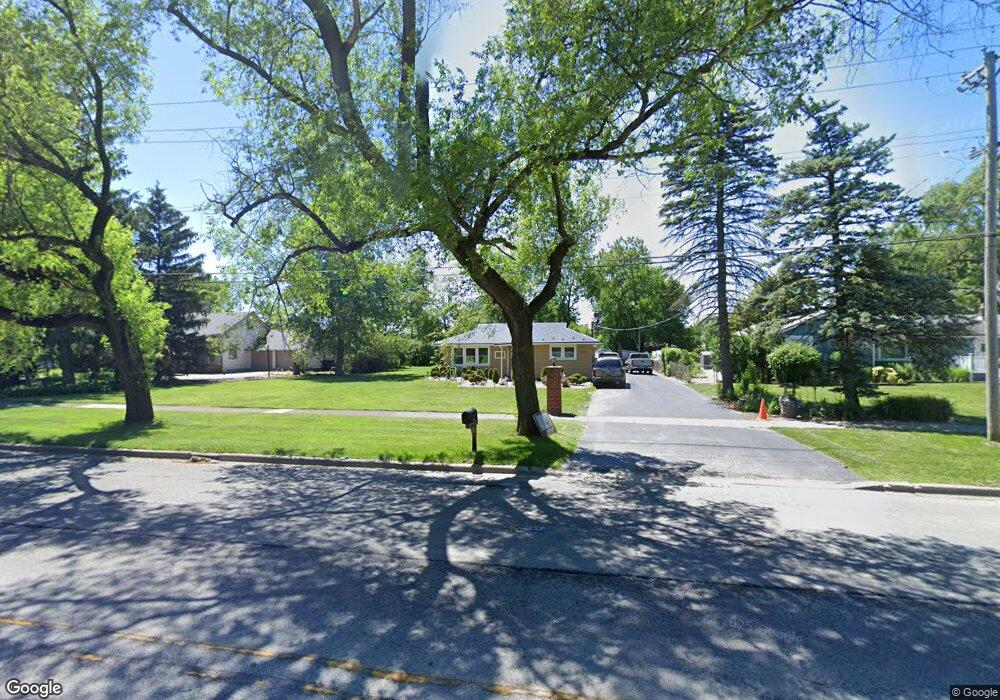
17228 Wentworth Ave Lansing, IL 60438
Estimated Value: $179,000 - $215,000
3
Beds
1
Bath
1,356
Sq Ft
$147/Sq Ft
Est. Value
About This Home
This home is located at 17228 Wentworth Ave, Lansing, IL 60438 and is currently estimated at $199,708, approximately $147 per square foot. 17228 Wentworth Ave is a home located in Cook County with nearby schools including Reavis Elementary School, Memorial Jr High School, and Thornton Fractnl So High School.
Ownership History
Date
Name
Owned For
Owner Type
Purchase Details
Closed on
Dec 15, 2009
Sold by
Hsbc Bank Usa Na
Bought by
Alvarez Jose C and Alvarez Antonia R
Current Estimated Value
Purchase Details
Closed on
Jan 19, 2009
Sold by
Garcia Ray V
Bought by
Hsbc Bank Usa Na
Purchase Details
Closed on
Jan 30, 2004
Sold by
Slager Thomas and Slager Tami
Bought by
Garcia Ray V
Home Financials for this Owner
Home Financials are based on the most recent Mortgage that was taken out on this home.
Original Mortgage
$120,115
Interest Rate
5.96%
Mortgage Type
FHA
Purchase Details
Closed on
Apr 12, 2001
Sold by
Otto Jack M
Bought by
Slager Thomas and Slager Tami
Home Financials for this Owner
Home Financials are based on the most recent Mortgage that was taken out on this home.
Original Mortgage
$86,300
Interest Rate
7.07%
Create a Home Valuation Report for This Property
The Home Valuation Report is an in-depth analysis detailing your home's value as well as a comparison with similar homes in the area
Home Values in the Area
Average Home Value in this Area
Purchase History
| Date | Buyer | Sale Price | Title Company |
|---|---|---|---|
| Alvarez Jose C | $48,000 | Ticor Title Insurance Co | |
| Hsbc Bank Usa Na | -- | None Available | |
| Garcia Ray V | $122,000 | -- | |
| Slager Thomas | $89,000 | -- |
Source: Public Records
Mortgage History
| Date | Status | Borrower | Loan Amount |
|---|---|---|---|
| Previous Owner | Garcia Ray V | $120,115 | |
| Previous Owner | Slager Thomas | $86,300 |
Source: Public Records
Tax History Compared to Growth
Tax History
| Year | Tax Paid | Tax Assessment Tax Assessment Total Assessment is a certain percentage of the fair market value that is determined by local assessors to be the total taxable value of land and additions on the property. | Land | Improvement |
|---|---|---|---|---|
| 2024 | $6,428 | $14,008 | $7,008 | $7,000 |
| 2023 | $4,298 | $16,600 | $9,600 | $7,000 |
| 2022 | $4,298 | $10,034 | $8,400 | $1,634 |
| 2021 | $4,237 | $10,033 | $8,400 | $1,633 |
| 2020 | $4,066 | $10,033 | $8,400 | $1,633 |
| 2019 | $4,445 | $11,237 | $7,800 | $3,437 |
| 2018 | $4,359 | $11,237 | $7,800 | $3,437 |
| 2017 | $4,436 | $11,237 | $7,800 | $3,437 |
| 2016 | $4,016 | $9,841 | $7,200 | $2,641 |
| 2015 | $3,667 | $9,841 | $7,200 | $2,641 |
| 2014 | $3,644 | $9,841 | $7,200 | $2,641 |
| 2013 | $3,867 | $11,217 | $7,200 | $4,017 |
Source: Public Records
Map
Nearby Homes
- 17244 Wentworth Ave
- 17246 Bernadine St
- 17204 Bernadine St
- 3636 172nd St
- 17258 William St
- 3540 Bernice Rd
- 17128 Grant St
- 3409 173rd Place
- 3514 170th Place
- 1678 State Line Rd
- 1647 Shirley Dr
- 17331 Community St
- 17 167th Place
- 3454 E 170th St
- 41 167th St
- 3347 Bernice Rd
- 17303 Roy St
- 17317 Roy St
- 36 167th St
- 17511 Maple Ave
- 17236 Wentworth Ave
- 17216 Wentworth Ave
- 17253 Bernadine St
- 17243 Bernadine St
- 17257 Bernadine St
- 17237 Bernadine St
- 17223 Bernadine St
- 17269 Bernadine St
- 17211 Bernadine St
- 17200 Wentworth Ave
- 17201 Bernadine St
- 17252 Bernadine St
- 17258 Bernadine St
- 17258 Wentworth Ave
- 17230 Bernadine St
- 17262 Bernadine St
- 3521 173rd St
- 17150 Wentworth Ave
- 17157 Bernadine St
- 17157 Bernadine St