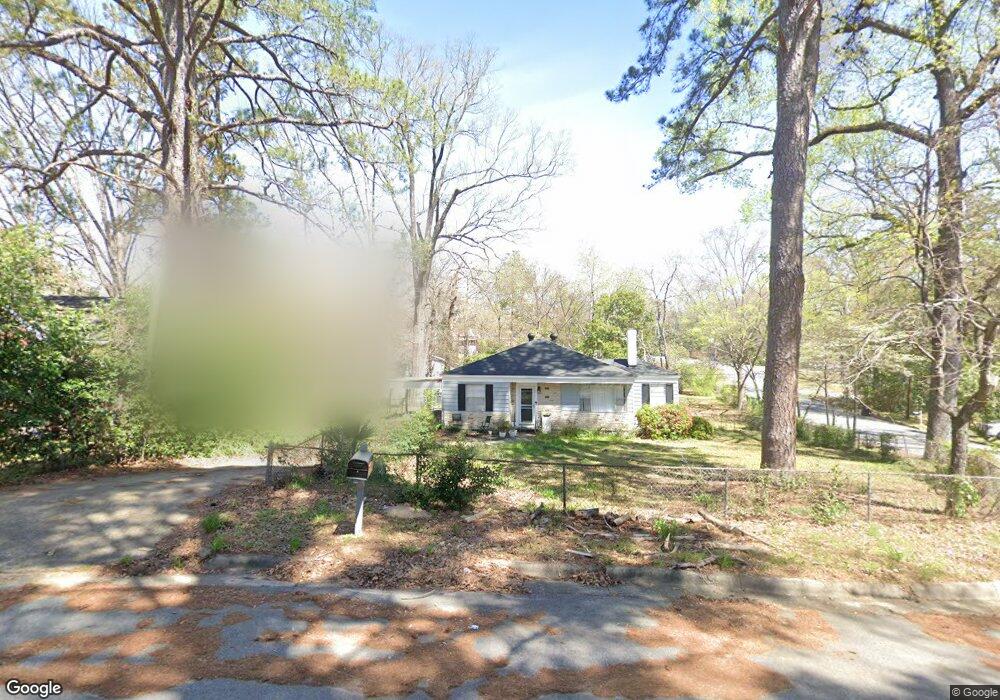
1723 39th St Columbus, GA 31904
Estimated Value: $126,097 - $147,000
2
Beds
2
Baths
1,216
Sq Ft
$112/Sq Ft
Est. Value
About This Home
This home is located at 1723 39th St, Columbus, GA 31904 and is currently estimated at $136,524, approximately $112 per square foot. 1723 39th St is a home located in Muscogee County with nearby schools including Johnson Elementary School, Richards Middle School, and Jordan Vocational High School.
Ownership History
Date
Name
Owned For
Owner Type
Purchase Details
Closed on
Sep 26, 2022
Sold by
Ruben Gonzales
Bought by
Stephens Michael Darnell
Current Estimated Value
Home Financials for this Owner
Home Financials are based on the most recent Mortgage that was taken out on this home.
Original Mortgage
$121,737
Outstanding Balance
$116,441
Interest Rate
5.22%
Mortgage Type
VA
Estimated Equity
$20,083
Purchase Details
Closed on
Apr 6, 2017
Sold by
Gonzales Sylvia G
Bought by
Gonzales Ruben
Purchase Details
Closed on
Jun 29, 2007
Sold by
Simmons Adam R and Simmons Lesley K
Bought by
Gonzales Reuben and Gonzales Sylvia
Home Financials for this Owner
Home Financials are based on the most recent Mortgage that was taken out on this home.
Original Mortgage
$63,862
Interest Rate
6.35%
Mortgage Type
Purchase Money Mortgage
Create a Home Valuation Report for This Property
The Home Valuation Report is an in-depth analysis detailing your home's value as well as a comparison with similar homes in the area
Home Values in the Area
Average Home Value in this Area
Purchase History
| Date | Buyer | Sale Price | Title Company |
|---|---|---|---|
| Stephens Michael Darnell | $119,000 | -- | |
| Gonzales Ruben | -- | -- | |
| Gonzales Reuben | $85,200 | None Available |
Source: Public Records
Mortgage History
| Date | Status | Borrower | Loan Amount |
|---|---|---|---|
| Open | Stephens Michael Darnell | $121,737 | |
| Previous Owner | Gonzales Reuben | $63,862 |
Source: Public Records
Tax History Compared to Growth
Tax History
| Year | Tax Paid | Tax Assessment Tax Assessment Total Assessment is a certain percentage of the fair market value that is determined by local assessors to be the total taxable value of land and additions on the property. | Land | Improvement |
|---|---|---|---|---|
| 2025 | $171 | $43,740 | $8,180 | $35,560 |
| 2024 | $171 | $43,740 | $8,180 | $35,560 |
| 2023 | $1,723 | $43,740 | $8,180 | $35,560 |
| 2022 | $950 | $33,868 | $8,180 | $25,688 |
| 2021 | $948 | $36,500 | $8,180 | $28,320 |
| 2020 | $1,491 | $36,500 | $8,180 | $28,320 |
| 2019 | $1,495 | $36,500 | $8,180 | $28,320 |
| 2018 | $1,495 | $36,500 | $8,180 | $28,320 |
| 2017 | $1,500 | $36,500 | $8,180 | $28,320 |
| 2016 | $1,534 | $37,198 | $3,966 | $33,232 |
| 2015 | $1,536 | $37,198 | $3,966 | $33,232 |
| 2014 | $615 | $37,198 | $3,966 | $33,232 |
| 2013 | -- | $37,198 | $3,966 | $33,232 |
Source: Public Records
Map
Nearby Homes
- 1703 39th St
- 1702 40th St
- 3905 Crestview Dr
- 1918 Rosemont Dr
- 3643 Calvin Dr
- 1717 42nd St
- 4109 Sherwood Ave
- 4220 18th Ave
- 2012 42nd St
- 2122 40th St
- 0 Warm Springs Rd
- 4213 16th Ave
- 2257 Camille Dr
- 3305 Cherokee Ave
- 3248 Cherokee Ave
- 4214 Saint Francis Ave Unit A
- 3232 Hillside Way
- 1810 Shannon Dr
- 3105 Woodlawn Ave
- 1719 Slade Dr