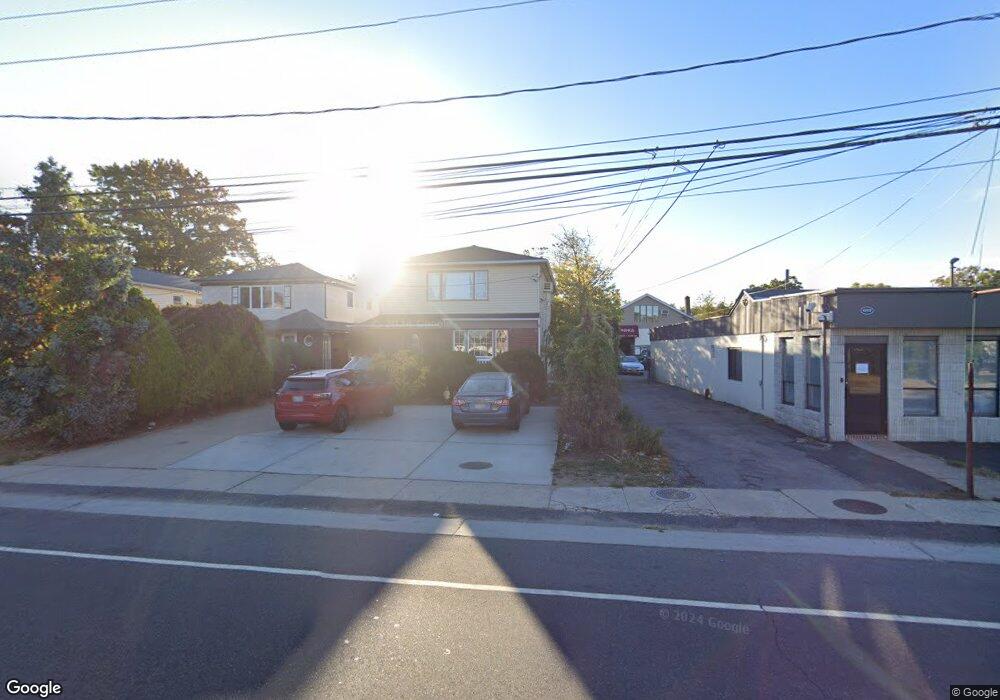
1723 Broadway Unit 1 Hewlett, NY 11557
Estimated Value: $919,080 - $977,000
3
Beds
2
Baths
2,175
Sq Ft
$436/Sq Ft
Est. Value
About This Home
This home is located at 1723 Broadway Unit 1, Hewlett, NY 11557 and is currently estimated at $948,040, approximately $435 per square foot. 1723 Broadway Unit 1 is a home located in Nassau County with nearby schools including George W Hewlett High School, Reenas Bais Yaakov, and Stella K. Abraham High School For Girls.
Ownership History
Date
Name
Owned For
Owner Type
Purchase Details
Closed on
Aug 5, 2025
Sold by
Torner Yariv
Bought by
Karako Daniel and Karako Anan
Current Estimated Value
Home Financials for this Owner
Home Financials are based on the most recent Mortgage that was taken out on this home.
Original Mortgage
$746,250
Outstanding Balance
$744,954
Interest Rate
6.72%
Mortgage Type
New Conventional
Estimated Equity
$203,086
Purchase Details
Closed on
Jul 12, 2019
Sold by
Anderson Helene and Cosentino Sherri
Bought by
Tomer Yariv
Home Financials for this Owner
Home Financials are based on the most recent Mortgage that was taken out on this home.
Original Mortgage
$500,000
Interest Rate
3.82%
Mortgage Type
New Conventional
Purchase Details
Closed on
Mar 3, 2017
Sold by
Nieber David and Main Helene
Bought by
Anderson Helene and Cosentino Sherri
Purchase Details
Closed on
Mar 28, 2001
Purchase Details
Closed on
Nov 3, 1995
Sold by
Silverman Frank
Bought by
Anderson Helene and Nieber Madeline
Purchase Details
Closed on
Apr 13, 1995
Sold by
Anderson Helene
Bought by
Silverman Frank
Create a Home Valuation Report for This Property
The Home Valuation Report is an in-depth analysis detailing your home's value as well as a comparison with similar homes in the area
Home Values in the Area
Average Home Value in this Area
Purchase History
| Date | Buyer | Sale Price | Title Company |
|---|---|---|---|
| Karako Daniel | $995,000 | Old Republic Natl Ttl Ins Co | |
| Karako Daniel | $995,000 | Old Republic Natl Ttl Ins Co | |
| Karako Daniel | $995,000 | Old Republic Natl Ttl Ins Co | |
| Karako Daniel | $995,000 | Old Republic Natl Ttl Ins Co | |
| Tomer Yariv | $750,000 | None Available | |
| Tomer Yariv | $750,000 | None Available | |
| Tomer Yariv | $750,000 | None Available | |
| Anderson Helene | -- | None Available | |
| Anderson Helene | -- | None Available | |
| Anderson Helene | -- | None Available | |
| -- | -- | -- | |
| -- | -- | -- | |
| Anderson Helene | -- | -- | |
| Anderson Helene | -- | -- | |
| Silverman Frank | $220,000 | -- | |
| Silverman Frank | $220,000 | -- | |
| Silverman Frank | $220,000 | -- |
Source: Public Records
Mortgage History
| Date | Status | Borrower | Loan Amount |
|---|---|---|---|
| Open | Karako Daniel | $746,250 | |
| Closed | Karako Daniel | $746,250 | |
| Previous Owner | Tomer Yariv | $500,000 |
Source: Public Records
Tax History Compared to Growth
Tax History
| Year | Tax Paid | Tax Assessment Tax Assessment Total Assessment is a certain percentage of the fair market value that is determined by local assessors to be the total taxable value of land and additions on the property. | Land | Improvement |
|---|---|---|---|---|
| 2025 | $17,484 | $551 | $196 | $355 |
| 2024 | $4,056 | $551 | $196 | $355 |
| 2023 | $17,687 | $634 | $225 | $409 |
| 2022 | $17,687 | $634 | $225 | $409 |
| 2021 | $30,029 | $619 | $220 | $399 |
| 2020 | $22,165 | $985 | $674 | $311 |
| 2019 | $4,641 | $985 | $674 | $311 |
| 2018 | $4,414 | $985 | $0 | $0 |
| 2017 | $12,607 | $985 | $674 | $311 |
| 2016 | $16,795 | $985 | $674 | $311 |
| 2015 | $3,873 | $985 | $674 | $311 |
| 2014 | $3,873 | $985 | $674 | $311 |
| 2013 | $3,616 | $985 | $674 | $311 |
Source: Public Records
Map
Nearby Homes
- 29 Avon Rd
- 131 Peninsula Blvd
- 596 Broadway Unit 14B
- 596 Broadway Unit 16B
- 51 Stevenson Rd
- 1584 Kew Ave
- 33 Farnum St
- 32 Harvard Ave
- 16 Farnum St
- 127 Gordon Rd
- 165 Page Rd
- 33 Starks Place
- 33 Prospect Ave
- 22 Everett St
- 1560 Pebble Ln
- 1555 Stevenson Rd
- 11 Duryea Place
- 29 Orleans Rd
- 21 Fremont Rd
- 366 Peninsula Blvd
- 1723 Broadway
- 1723 Broadway Unit 2
- 1729 Broadway
- 1729 Broadway Unit 1
- 1717 Broadway
- 1717 Broadway
- 1717 Broadway Unit 1
- 1717 Broadway Unit 2
- 1733 Broadway
- 1733 Broadway Unit 2nd Fl
- 1715 Broadway
- 1737 Broadway
- 1741 Broadway
- 1761 Broadway
- 20 Sheridan Ave
- 1763 Broadway
- 1734 Hancock St
- 1734 Hancock St Unit 2
- 1740 Hancock St
- 1728 Hancock St