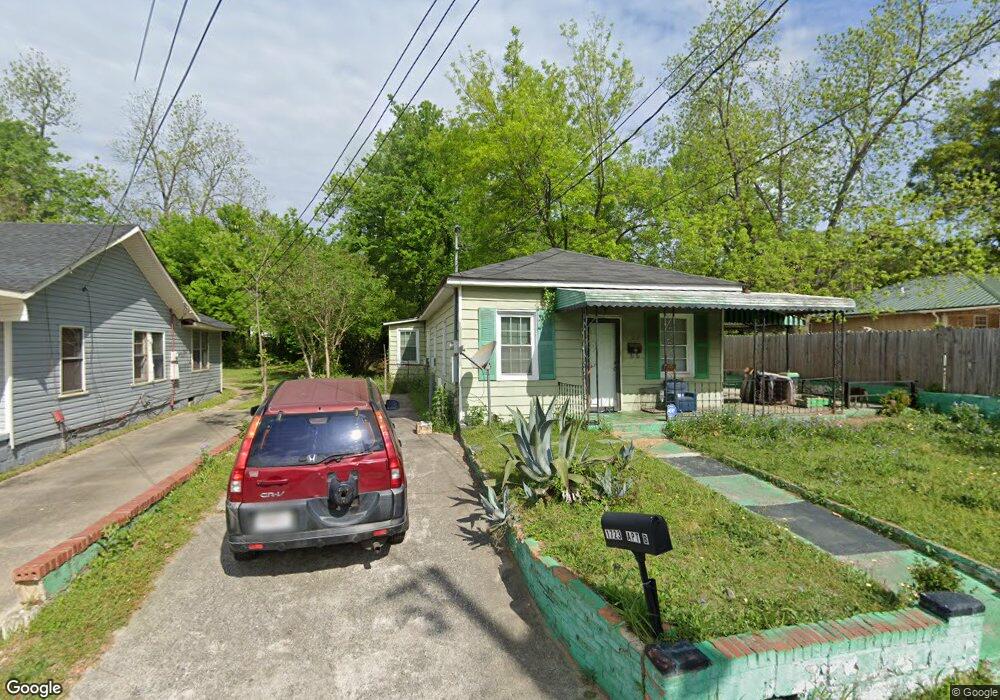
1723 Cedar St Macon, GA 31201
Tindall Heights Historic District NeighborhoodEstimated Value: $63,000 - $127,000
3
Beds
2
Baths
1,475
Sq Ft
$60/Sq Ft
Est. Value
About This Home
This home is located at 1723 Cedar St, Macon, GA 31201 and is currently estimated at $88,881, approximately $60 per square foot. 1723 Cedar St is a home located in Bibb County with nearby schools including Ingram-Pye Elementary School, Central High School, and Cirrus Charter Academy.
Ownership History
Date
Name
Owned For
Owner Type
Purchase Details
Closed on
Nov 24, 2025
Sold by
Wayward Properties Llc
Bought by
Nbrc 1723 Cedar Llc
Current Estimated Value
Purchase Details
Closed on
Oct 2, 2024
Sold by
South Holston Capital Ga Llc
Bought by
Wayward Properties Llc
Purchase Details
Closed on
Oct 24, 2019
Sold by
Sands Terry Lamar and Sands Shavetta Telisha
Bought by
South Holston Capital Ga Llc
Purchase Details
Closed on
Aug 14, 2017
Sold by
Sands Shavetta Telisha
Bought by
Sands Shavetta Telisha and Sands Terry Lamar
Purchase Details
Closed on
Jun 7, 1999
Sold by
Deshazier Oscar
Bought by
Deshazier Estoria
Create a Home Valuation Report for This Property
The Home Valuation Report is an in-depth analysis detailing your home's value as well as a comparison with similar homes in the area
Home Values in the Area
Average Home Value in this Area
Purchase History
| Date | Buyer | Sale Price | Title Company |
|---|---|---|---|
| Nbrc 1723 Cedar Llc | $80,000 | None Listed On Document | |
| Wayward Properties Llc | $335,500 | None Listed On Document | |
| South Holston Capital Ga Llc | $12,000 | None Available | |
| Sands Shavetta Telisha | -- | None Available | |
| Deshazier Estoria | -- | -- |
Source: Public Records
Tax History
| Year | Tax Paid | Tax Assessment Tax Assessment Total Assessment is a certain percentage of the fair market value that is determined by local assessors to be the total taxable value of land and additions on the property. | Land | Improvement |
|---|---|---|---|---|
| 2025 | $611 | $24,854 | $2,180 | $22,674 |
| 2024 | $615 | $24,234 | $1,560 | $22,674 |
| 2023 | $649 | $21,921 | $1,300 | $20,621 |
| 2022 | $651 | $18,802 | $3,902 | $14,900 |
| 2021 | $593 | $15,609 | $3,902 | $11,707 |
| 2020 | $186 | $15,609 | $3,902 | $11,707 |
| 2019 | $449 | $11,473 | $3,902 | $7,571 |
| 2018 | $868 | $11,473 | $3,902 | $7,571 |
| 2017 | $430 | $11,473 | $3,902 | $7,571 |
| 2016 | $397 | $11,473 | $3,902 | $7,571 |
| 2015 | $219 | $11,473 | $3,902 | $7,571 |
| 2014 | $304 | $11,473 | $3,902 | $7,571 |
Source: Public Records
Map
Nearby Homes
Your Personal Tour Guide
Ask me questions while you tour the home.