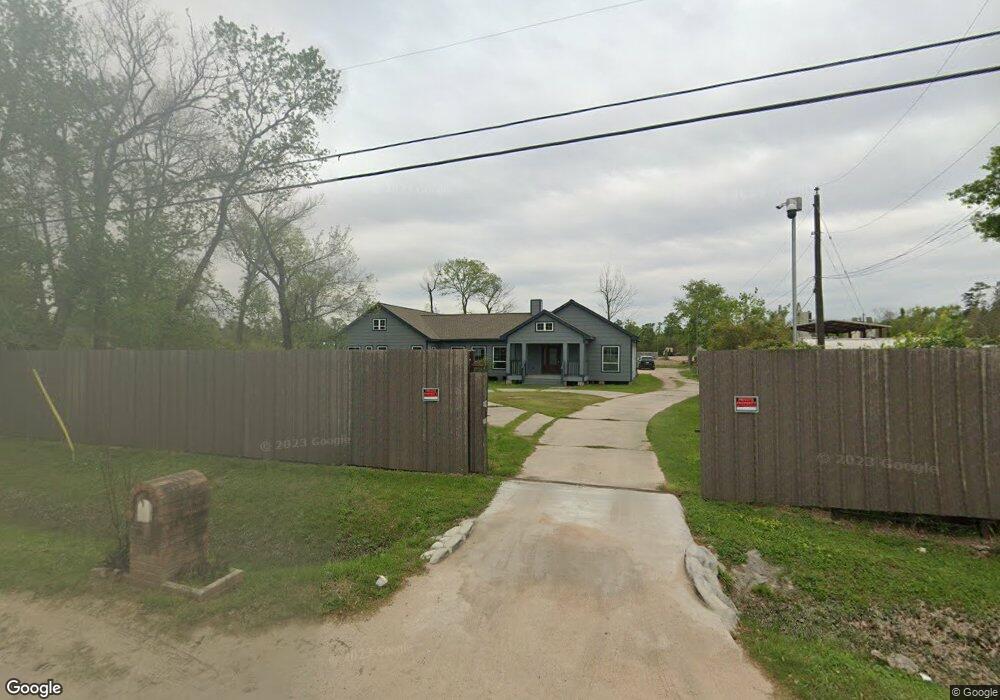
1723 De Soto St Houston, TX 77091
Acres Homes NeighborhoodEstimated Value: $562,000 - $891,622
3
Beds
2
Baths
2,999
Sq Ft
$252/Sq Ft
Est. Value
About This Home
This home is located at 1723 De Soto St, Houston, TX 77091 and is currently estimated at $754,656, approximately $251 per square foot. 1723 De Soto St is a home located in Harris County with nearby schools including Reece Academy, Anderson Academy, and Drew Academy.
Ownership History
Date
Name
Owned For
Owner Type
Purchase Details
Closed on
May 27, 2021
Sold by
Vannguyen Thien Van
Bought by
T Sugar Investments Llc
Current Estimated Value
Home Financials for this Owner
Home Financials are based on the most recent Mortgage that was taken out on this home.
Original Mortgage
$923,000
Outstanding Balance
$832,012
Interest Rate
2.9%
Mortgage Type
Unknown
Estimated Equity
-$77,356
Purchase Details
Closed on
Feb 25, 2013
Sold by
Wilkerson Cornelias and Wilkerson Deborah A
Bought by
Nguyen Property Investment Llc
Purchase Details
Closed on
Feb 25, 1997
Sold by
Guinn Joe Lee
Bought by
Wilkerson Cornelias and Wilkerson Deborah A
Home Financials for this Owner
Home Financials are based on the most recent Mortgage that was taken out on this home.
Original Mortgage
$8,000
Interest Rate
7.55%
Mortgage Type
Seller Take Back
Create a Home Valuation Report for This Property
The Home Valuation Report is an in-depth analysis detailing your home's value as well as a comparison with similar homes in the area
Home Values in the Area
Average Home Value in this Area
Purchase History
| Date | Buyer | Sale Price | Title Company |
|---|---|---|---|
| T Sugar Investments Llc | -- | Great American Title Company | |
| Nguyen Property Investment Llc | -- | Frontier Title Co | |
| Wilkerson Cornelias | $10,000 | -- |
Source: Public Records
Mortgage History
| Date | Status | Borrower | Loan Amount |
|---|---|---|---|
| Open | T Sugar Investments Llc | $923,000 | |
| Previous Owner | Wilkerson Cornelias | $8,000 |
Source: Public Records
Tax History Compared to Growth
Tax History
| Year | Tax Paid | Tax Assessment Tax Assessment Total Assessment is a certain percentage of the fair market value that is determined by local assessors to be the total taxable value of land and additions on the property. | Land | Improvement |
|---|---|---|---|---|
| 2025 | $18,576 | $890,377 | $795,496 | $94,881 |
| 2024 | $18,576 | $818,500 | $795,496 | $23,004 |
| 2023 | $18,576 | $773,911 | $691,736 | $82,175 |
| 2022 | $5,738 | $526,980 | $432,335 | $94,645 |
| 2021 | $10,047 | $400,000 | $344,804 | $55,196 |
| 2020 | $7,266 | $275,291 | $215,503 | $59,788 |
| 2019 | $7,618 | $275,291 | $215,503 | $59,788 |
| 2018 | $2,917 | $203,132 | $146,542 | $56,590 |
| 2017 | $5,389 | $203,132 | $146,542 | $56,590 |
| 2016 | $4,735 | $178,496 | $129,302 | $49,194 |
| 2015 | $3,754 | $178,496 | $129,302 | $49,194 |
| 2014 | $3,754 | $141,068 | $81,891 | $59,177 |
Source: Public Records
Map
Nearby Homes
- 1825 De Soto St
- 1804 Mansfield St
- 1814 Mansfield St
- 1501 De Soto St Unit 6104
- 1501 De Soto St Unit 6130
- 1501 De Soto St Unit 6128
- 00000 Mansfield St
- 1816 Mansfield St
- 1704 Mansfield St
- 1716 Mansfield St
- 5816 Highland Sky Ln
- 5814 Highland Sky Ln
- 5812 Highland Sky Ln
- 5810 Highland Sky Ln
- 5808 Highland Sky Ln
- 1321 De Soto St
- 1406 Homer St Unit 2
- 5918 Manning Oaks St
- 6417 Lamayah St
- 6407 Lamayah St
- 1709 De Soto St
- 1747 De Soto St
- 1712 De Soto St
- 1629 De Soto St
- 1702 De Soto St
- 0 Lots 39 and 40 Knox St
- 1626 De Soto St
- 1800 De Soto St
- 1622 De Soto St
- 1615 De Soto St
- 1901 De Soto St
- 1618 De Soto St
- 1611 De Soto St
- 6009 Midgeley St
- 1900 De Soto St
- 5917 Midgeley St
- 1502 Acreage Ln
- 1510 Acreage Ln
- 2212 Oak Forest of La Sierra
- 6001 Midgeley St