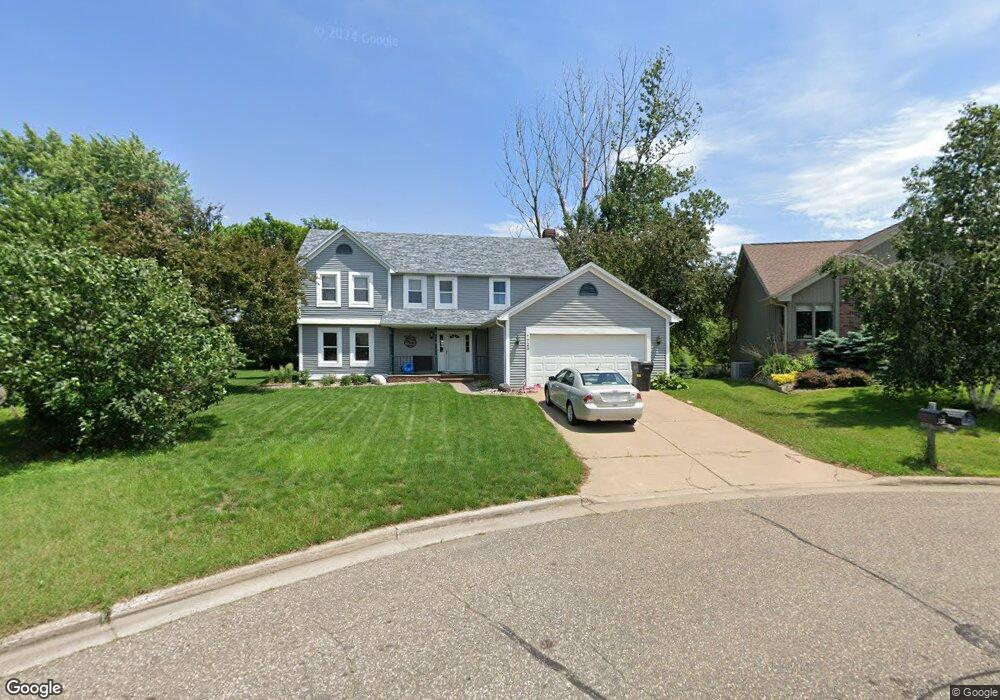
1723 Laurel Ave Hudson, WI 54016
Estimated Value: $508,000 - $534,193
4
Beds
3
Baths
2,672
Sq Ft
$196/Sq Ft
Est. Value
About This Home
This home is located at 1723 Laurel Ave, Hudson, WI 54016 and is currently estimated at $525,048, approximately $196 per square foot. 1723 Laurel Ave is a home located in St. Croix County with nearby schools including E.P. Rock Elementary School, Hudson Middle School, and Hudson High School.
Ownership History
Date
Name
Owned For
Owner Type
Purchase Details
Closed on
Apr 14, 2016
Sold by
Merchak Peggy A
Bought by
Carriveau Wenz Jr Eric J and Carriveau Wenz Teresa Rae
Current Estimated Value
Home Financials for this Owner
Home Financials are based on the most recent Mortgage that was taken out on this home.
Original Mortgage
$246,000
Outstanding Balance
$195,752
Interest Rate
3.73%
Mortgage Type
New Conventional
Estimated Equity
$329,296
Purchase Details
Closed on
May 4, 2009
Sold by
Merchak Joseph D
Bought by
Merchak Peggy A
Home Financials for this Owner
Home Financials are based on the most recent Mortgage that was taken out on this home.
Original Mortgage
$216,800
Interest Rate
4.83%
Mortgage Type
New Conventional
Create a Home Valuation Report for This Property
The Home Valuation Report is an in-depth analysis detailing your home's value as well as a comparison with similar homes in the area
Home Values in the Area
Average Home Value in this Area
Purchase History
| Date | Buyer | Sale Price | Title Company |
|---|---|---|---|
| Carriveau Wenz Jr Eric J | $266,000 | Partners Title | |
| Merchak Peggy A | -- | Key Title Inc |
Source: Public Records
Mortgage History
| Date | Status | Borrower | Loan Amount |
|---|---|---|---|
| Open | Carriveau Wenz Jr Eric J | $246,000 | |
| Previous Owner | Merchak Peggy A | $216,800 |
Source: Public Records
Tax History Compared to Growth
Tax History
| Year | Tax Paid | Tax Assessment Tax Assessment Total Assessment is a certain percentage of the fair market value that is determined by local assessors to be the total taxable value of land and additions on the property. | Land | Improvement |
|---|---|---|---|---|
| 2024 | $66 | $382,900 | $77,100 | $305,800 |
| 2023 | $6,295 | $382,900 | $77,100 | $305,800 |
| 2022 | $5,878 | $382,900 | $77,100 | $305,800 |
| 2021 | $5,978 | $382,900 | $77,100 | $305,800 |
| 2020 | $5,925 | $382,900 | $77,100 | $305,800 |
| 2019 | $5,595 | $292,100 | $71,000 | $221,100 |
| 2018 | $5,545 | $292,100 | $71,000 | $221,100 |
| 2017 | $5,281 | $292,100 | $71,000 | $221,100 |
| 2016 | $5,281 | $292,100 | $71,000 | $221,100 |
| 2015 | $4,964 | $292,100 | $71,000 | $221,100 |
| 2014 | $4,843 | $292,100 | $71,000 | $221,100 |
| 2013 | $5,511 | $292,100 | $71,000 | $221,100 |
Source: Public Records
Map
Nearby Homes
- 2304 Hillcrest Dr
- 1542 Aldrich Ave
- 1262 Wisconsin 35
- 1818 Hunter Hill Rd
- 2223 White Pine Rd
- 1520 Hunter Hill Rd
- 1603 Hunter Hill Rd
- 834 Evergreen Cir
- 493 Kerry Way
- 604 Topaz Ln
- 907 Coulee Rd Unit 105
- 1324 Carriage Dr Unit B
- 1337 Heggen St Unit 1B
- 724 Wisconsin St
- 1620 Namekagon St Unit 3
- 1100 Front St S
- 611 9th St
- 2208 Cattail Way
- 719 Countryview Cir
- 464 Stageline Rd
- 1721 Laurel Ave
- 1954 Halston Ct
- 1725 Laurel Ave
- 1719 Laurel Ave
- 1951 Halston Ct
- 1727 Laurel Ave
- 1958 Halston Ct
- 1733 Laurel Ave
- 1717 Laurel Ave
- 1729 Laurel Ave
- 1731 Laurel Ave
- 1955 Halston Ct
- 1962 Halston Ct
- 1725 Cudd Cir
- 1859 Hinsdale Cir
- 1859 Hinsdale Cir
- 1829 Fairway Dr
- 1831 Fairway Dr
- 1827 Fairway Dr Unit 1827
- 1959 Halston Ct