Estimated Value: $171,000 - $206,000
3
Beds
2
Baths
1,338
Sq Ft
$138/Sq Ft
Est. Value
About This Home
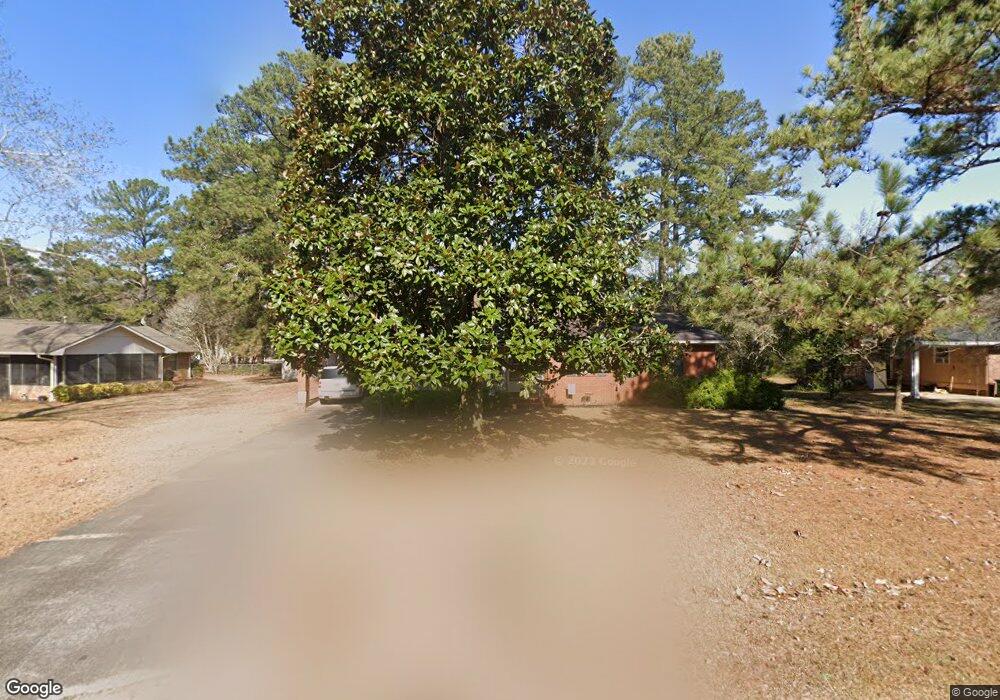
This home is located at 1723 Milton Way, Perry, GA 31069 and is currently estimated at $184,553, approximately $137 per square foot. 1723 Milton Way is a home located in Houston County with nearby schools including Morningside Elementary School, Perry Middle School, and Perry High School.
Ownership History
Date
Name
Owned For
Owner Type
Purchase Details
Closed on
May 5, 2000
Sold by
Bell Constance Lynn
Bought by
Grim Debra J
Current Estimated Value
Purchase Details
Closed on
Aug 9, 1985
Sold by
Fauconniere Jean Elizabeth
Bought by
Fauconniere Constance Lynn
Purchase Details
Closed on
Mar 17, 1980
Sold by
Moore John D
Bought by
Fauconniere Jean Elizabeth
Purchase Details
Closed on
Sep 18, 1974
Sold by
Beavers J G
Bought by
Moore John D
Purchase Details
Closed on
Feb 27, 1974
Sold by
Shafer Thomas I
Bought by
Beavers J G
Purchase Details
Closed on
May 5, 1972
Sold by
Mcmillan Ronald B
Bought by
Shafer Thomas I
Purchase Details
Closed on
Feb 23, 1970
Sold by
Hoover Gladys B
Bought by
Mcmillan Ronald B
Purchase Details
Closed on
Aug 16, 1966
Sold by
Johnson John W
Bought by
Goheen Gladys B
Purchase Details
Closed on
Jan 1, 1965
Sold by
Downing Robert H
Bought by
Johnson John W
Purchase Details
Closed on
Mar 25, 1963
Bought by
Downing Robert H
Create a Home Valuation Report for This Property
The Home Valuation Report is an in-depth analysis detailing your home's value as well as a comparison with similar homes in the area
Home Values in the Area
Average Home Value in this Area
Purchase History
| Date | Buyer | Sale Price | Title Company |
|---|---|---|---|
| Grim Debra J | $69,000 | -- | |
| Fauconniere Constance Lynn | -- | -- | |
| Fauconniere Jean Elizabeth | -- | -- | |
| Moore John D | -- | -- | |
| Beavers J G | -- | -- | |
| Shafer Thomas I | -- | -- | |
| Mcmillan Ronald B | -- | -- | |
| Goheen Gladys B | -- | -- | |
| Johnson John W | -- | -- | |
| Downing Robert H | -- | -- |
Source: Public Records
Tax History Compared to Growth
Tax History
| Year | Tax Paid | Tax Assessment Tax Assessment Total Assessment is a certain percentage of the fair market value that is determined by local assessors to be the total taxable value of land and additions on the property. | Land | Improvement |
|---|---|---|---|---|
| 2024 | $1,583 | $51,800 | $10,000 | $41,800 |
| 2023 | $1,298 | $43,800 | $10,000 | $33,800 |
| 2022 | $714 | $40,200 | $10,000 | $30,200 |
| 2021 | $624 | $36,120 | $10,000 | $26,120 |
| 2020 | $598 | $34,880 | $10,000 | $24,880 |
| 2019 | $764 | $34,880 | $10,000 | $24,880 |
| 2018 | $764 | $34,880 | $10,000 | $24,880 |
| 2017 | $765 | $34,880 | $10,000 | $24,880 |
| 2016 | $766 | $34,880 | $10,000 | $24,880 |
| 2015 | $767 | $34,880 | $10,000 | $24,880 |
| 2014 | -- | $34,880 | $10,000 | $24,880 |
| 2013 | -- | $34,880 | $10,000 | $24,880 |
Source: Public Records
Map
Nearby Homes
- 1009 N Davis Dr
- 1304 Davis Ave
- 113 Flat Rock Ln
- 100 Flat Rock Ln
- 1802 Kings Chapel Rd
- 1402 Park Ave
- 312 Bridgehampton Way
- 102 N Haven Ln
- 1152 Lovely Ln
- 1205 Morningside Dr
- 132 Sadie Heights Blvd
- 138 Sadie Heights Blvd
- 137 Sadie Heights Blvd
- 135 Sadie Heights Blvd
- 1015 Cherokee Rd
- 1008 Ridge Cir S
- 1405 Cambridge Rd
- 412 Legacy Park Dr
- 500 Legacy Park Dr
- 314 Waxmyrtle Way
- 1725 Milton Way
- 1721 Milton Way
- 1006 N Davis Dr
- 1005 Pine Place
- 1724 Milton Way
- 1722 Milton Way
- 1008 N Davis Dr
- 1726 Milton Way
- 1726 Milton Way
- 1007 Pine Place
- 1720 Milton Way
- 1011 N Davis Dr
- 1728 Milton Way
- 1006 Pine Place
- 1013 N Davis Dr
- 1010 N Davis Dr
- 1009 Pine Place
- 1733 Houston Lake Rd
- 1007 N Davis Dr
- 1015 N Davis Dr